
Airport traffic numbers tend to be reported as a single ranking, but the year-over-year changes tell a more varied story. Federal Aviation Administration data for 2025 show growth at some hubs and sharp declines at others. Here are the twelve busiest airports in the country by boardings, with each one’s enplanement total.
Help yourself and the planet: The Cool Down makes it easy to help yourself while helping the planet, with smart, simple changes to save more and waste less in your everyday life.
We may earn a commission if you sign up.
1. Hartsfield-Jackson Atlanta International: The Undisputed Leader
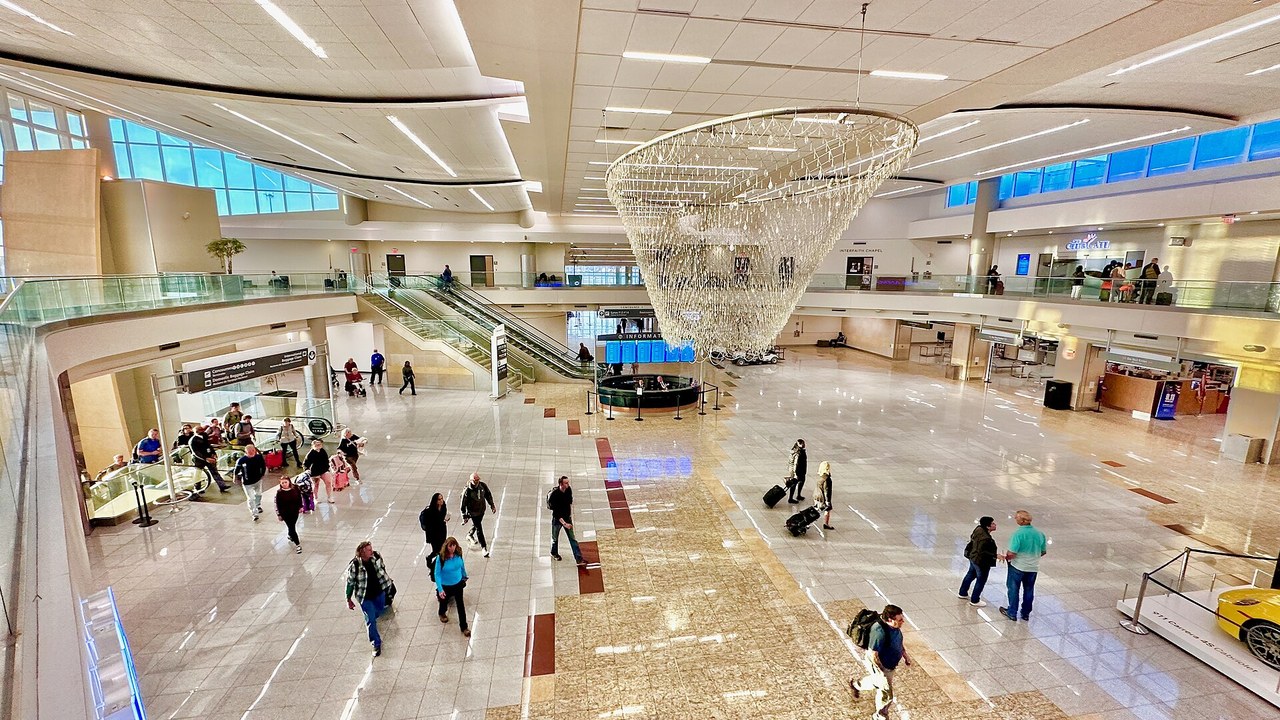
Atlanta led every U.S. airport in 2025 with 51,459,786 enplanements, down 2.00% from 2024, according to the FAA enplanement table. Even with the dip, it stayed well ahead of the field.
Enplanements count each passenger boarding, so connecting travelers show up more than once. That helps explain why a hub like Atlanta posts such large totals, and why a decline can still leave it far in front. Atlanta’s total is a reminder that hub size and growth are separate questions.
2. Dallas-Fort Worth International: Texas-Sized Traffic
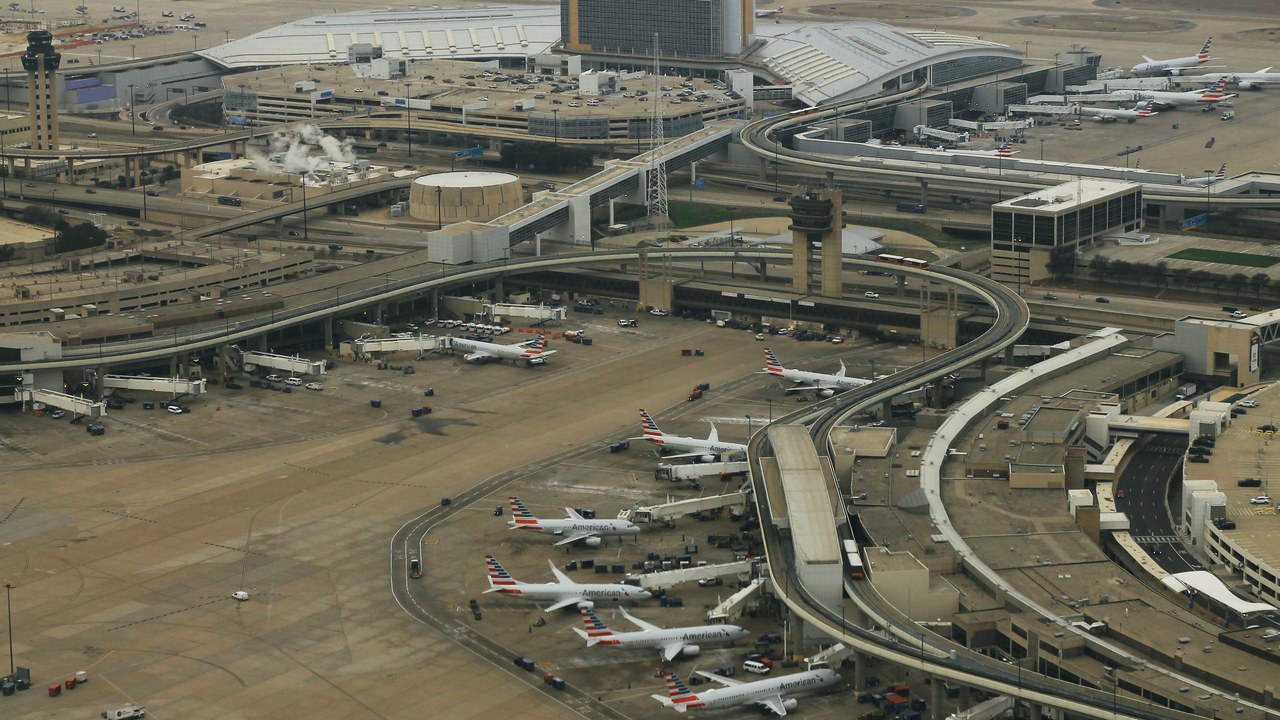
Dallas-Fort Worth ranked second in 2025 at 41,297,009 enplanements, down 2.49%, based on the FAA commercial service enplanements list. The total was down from 42,351,316 the year before.
A one-year drop of that size is a snapshot, not a verdict on a hub’s long-term direction. Travelers should treat the ranking as a measure of boardings, not of delays or service quality. Comparing it with Atlanta and O’Hare above shows how tightly the top airports are clustered.
3. Chicago O’Hare International: Chicago Climbs
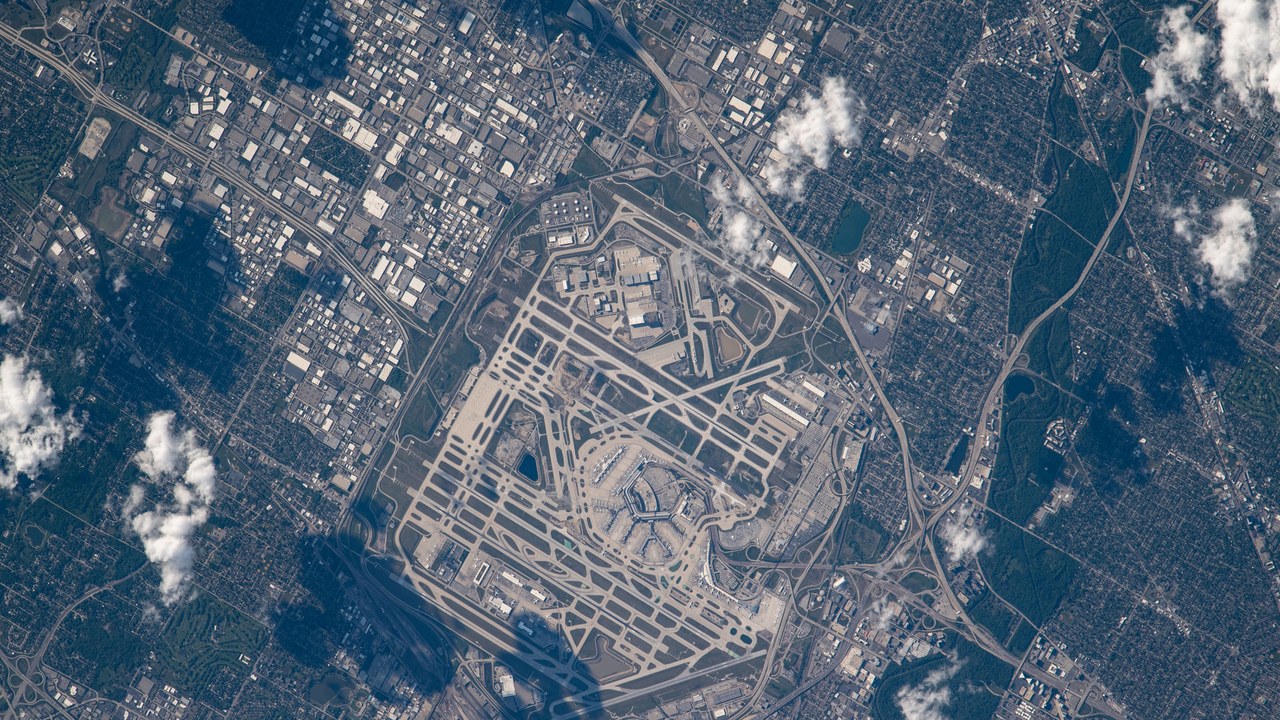
O’Hare logged 40,680,735 enplanements in 2025, up 5.46%, the biggest gain among the top five, per the FAA all-enplanements table. The year before it recorded 38,575,693.
Growth at O’Hare stands out because most of its neighbors in the ranking fell. Passengers should still check airline schedules directly, since enplanement totals say nothing about any particular route. It is worth comparing the percentage changes of the neighboring hubs for context. Totals alone do not explain why traffic grew.
4. Denver International: Flat in the Mountains
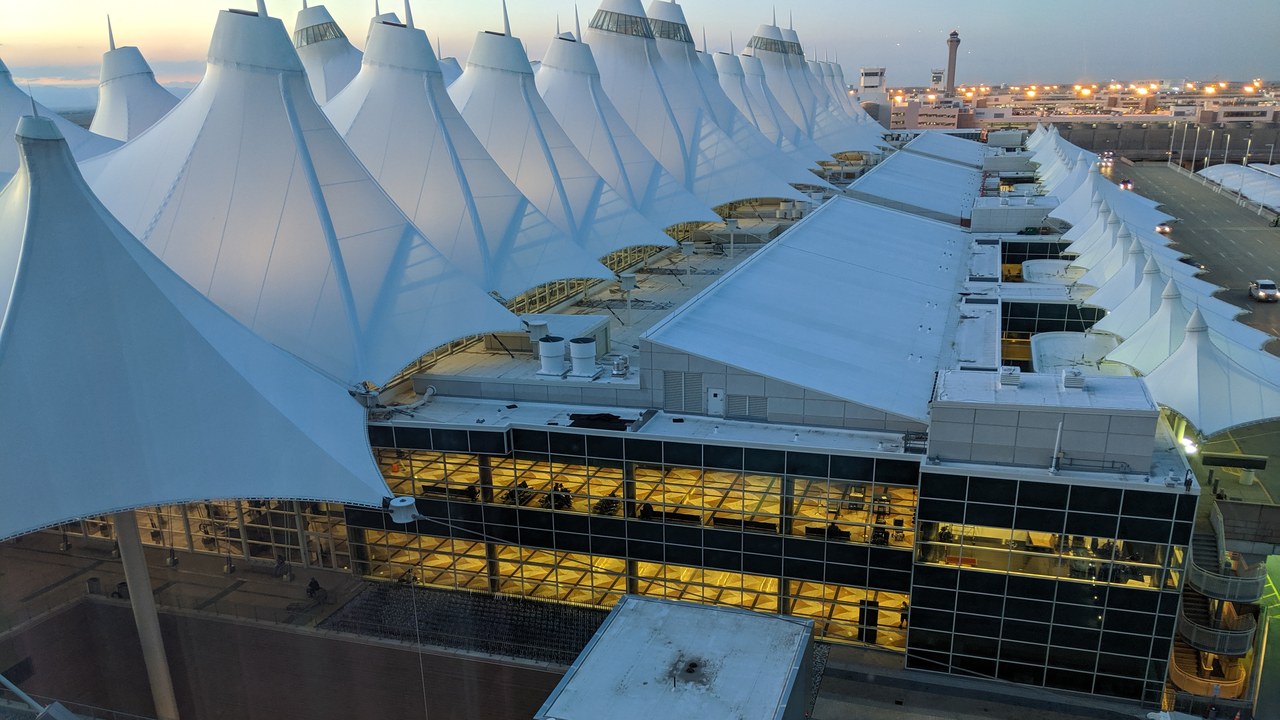
Denver handled 39,976,695 enplanements in 2025, essentially flat at a change of 0.09% down, according to the FAA enplanement table. The prior year’s total was 40,012,895.
A near-identical total suggests demand held steady at Denver while other hubs moved more. Readers comparing airports should look at the percentage change as well as the raw boarding count. Flat results can still hide changes in the mix of routes and airlines. Total boardings are only one way to measure activity.
5. Los Angeles International: West Coast Giant
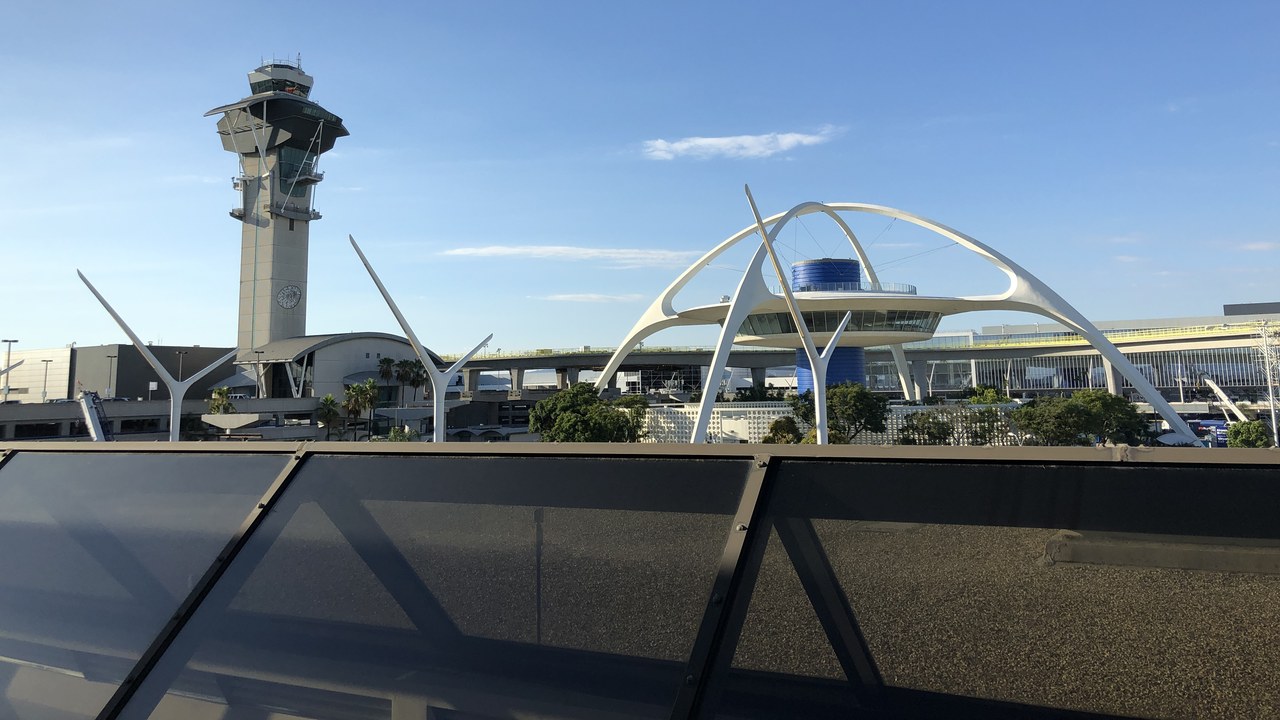
LAX boarded 36,497,303 passengers in 2025, down 3.35% from 37,760,834, as shown in the FAA passenger enplanements data. It ranked fifth among airports nationally.
The decline of more than a million boardings is large in absolute terms even though the percentage looks modest. Anyone planning travel through LAX should rely on airline and airport notices for current conditions. Comparing it with the other California and western hubs offers additional context.
6. John F. Kennedy International: New York’s Biggest Gateway
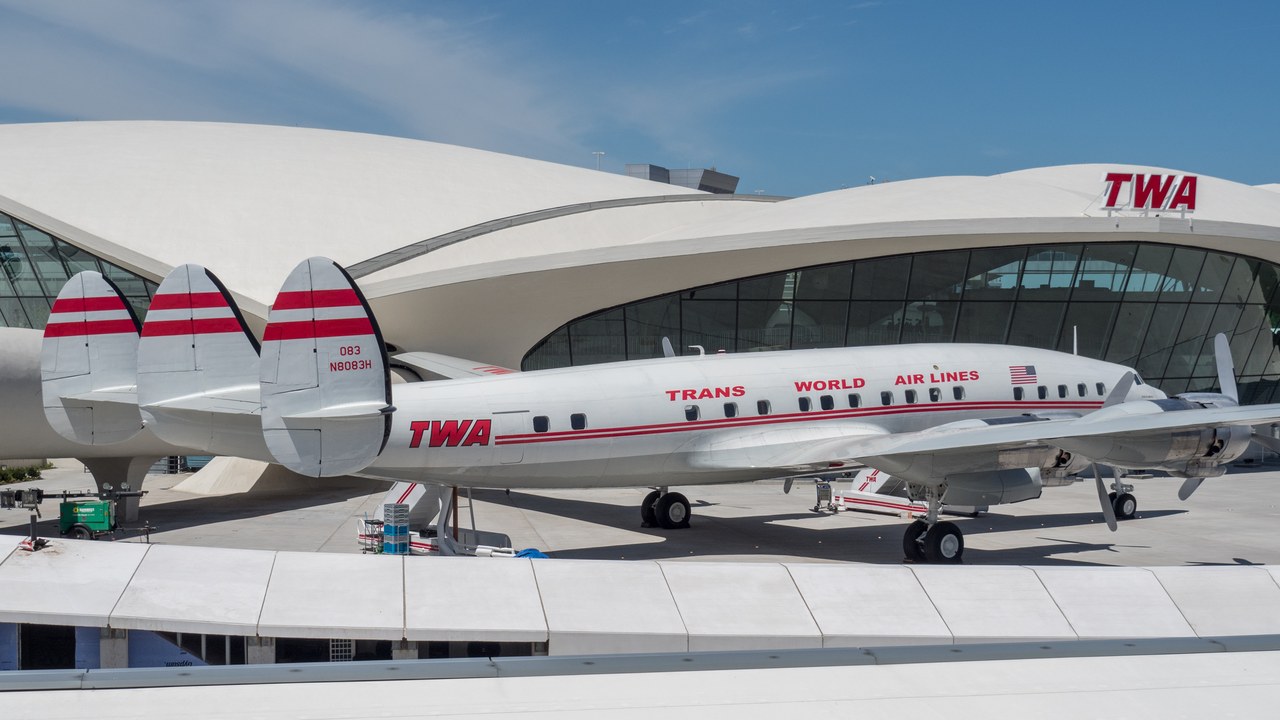
JFK recorded 30,792,806 enplanements in 2025, down 2.14%, per the FAA commercial service list. The prior-year total was 31,466,102.
JFK’s figure counts boardings only, so it does not capture arrivals or the many international connections that pass through. Travelers comparing New York airports should check the same measure for each. Looking at the percentage change alongside the total gives a fuller picture of the year. Per-airline detail is not part of this table.
7. Orlando International: Theme-Park Traffic
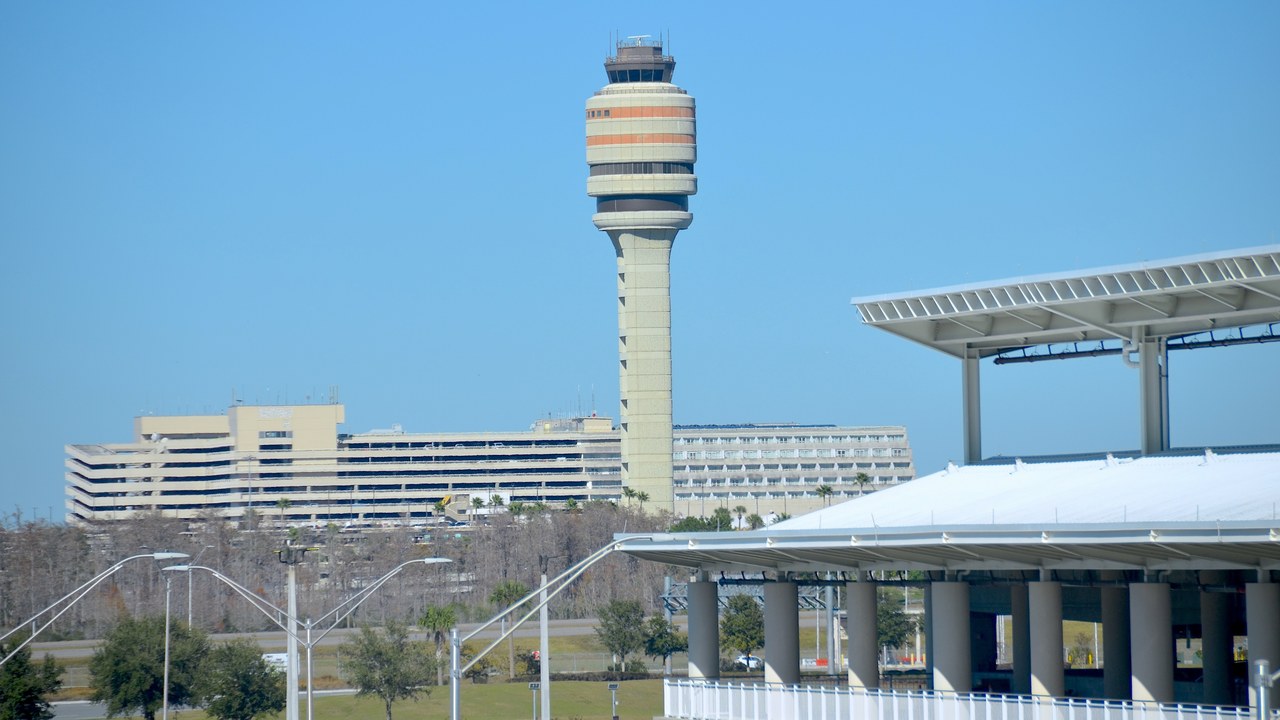
Orlando ranked seventh in 2025 with 27,999,709 enplanements, according to Wikipedia’s busiest airports list. The ranking sits just ahead of Las Vegas and Miami.
The figure comes from a reference table rather than the FAA document itself, so readers wanting precision can compare it with the official data. Orlando’s position shows how a leisure destination can rank among much larger hubs. Seasonal travel patterns can also shape a leisure airport’s annual figures, though the data here does not break them out.
8. Harry Reid International (Las Vegas): The Steepest Slide
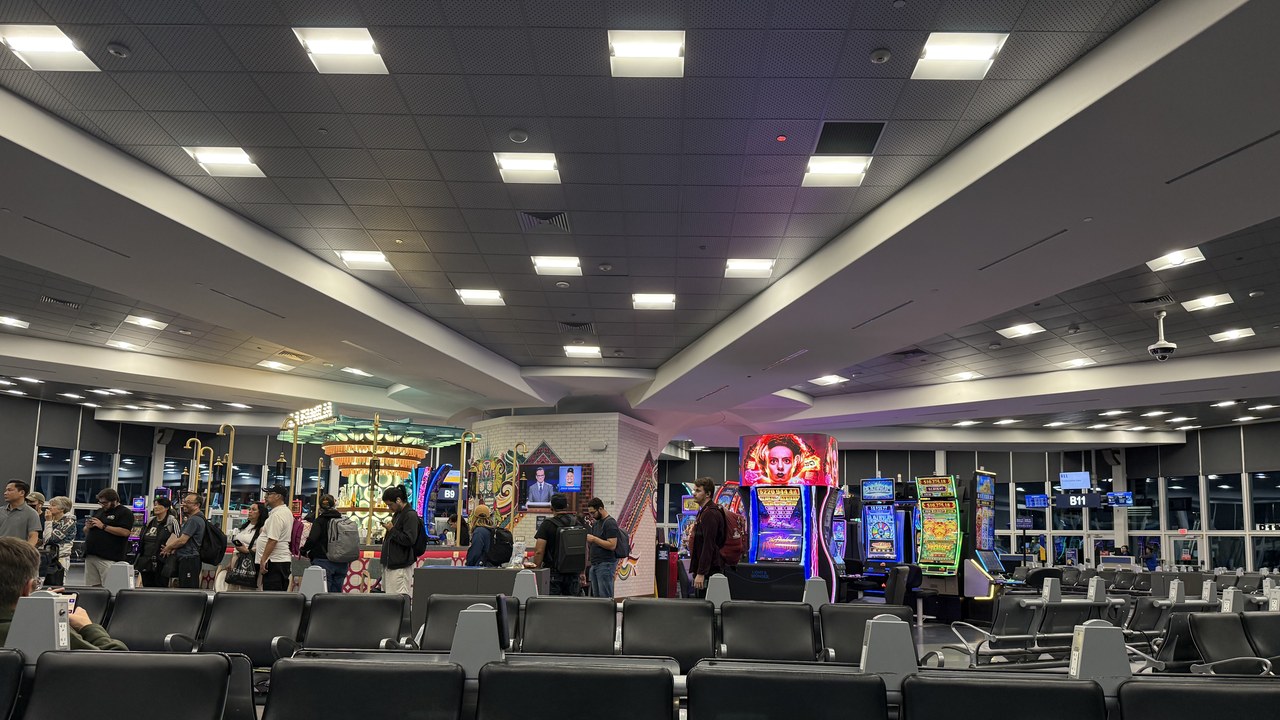
Las Vegas slid 6.07% in 2025 to 26,531,765 enplanements, the steepest drop in the top 10, according to the FAA commercial service enplanements table. The previous year it had recorded 28,244,966.
A decline that large stands out in a ranking where most changes were small. Visitors planning Las Vegas trips should keep in mind that these totals measure boardings, not hotel or tourism figures. Comparing the change with Orlando and Miami nearby in the ranking adds some perspective.
9. Miami International: Gateway to Latin America
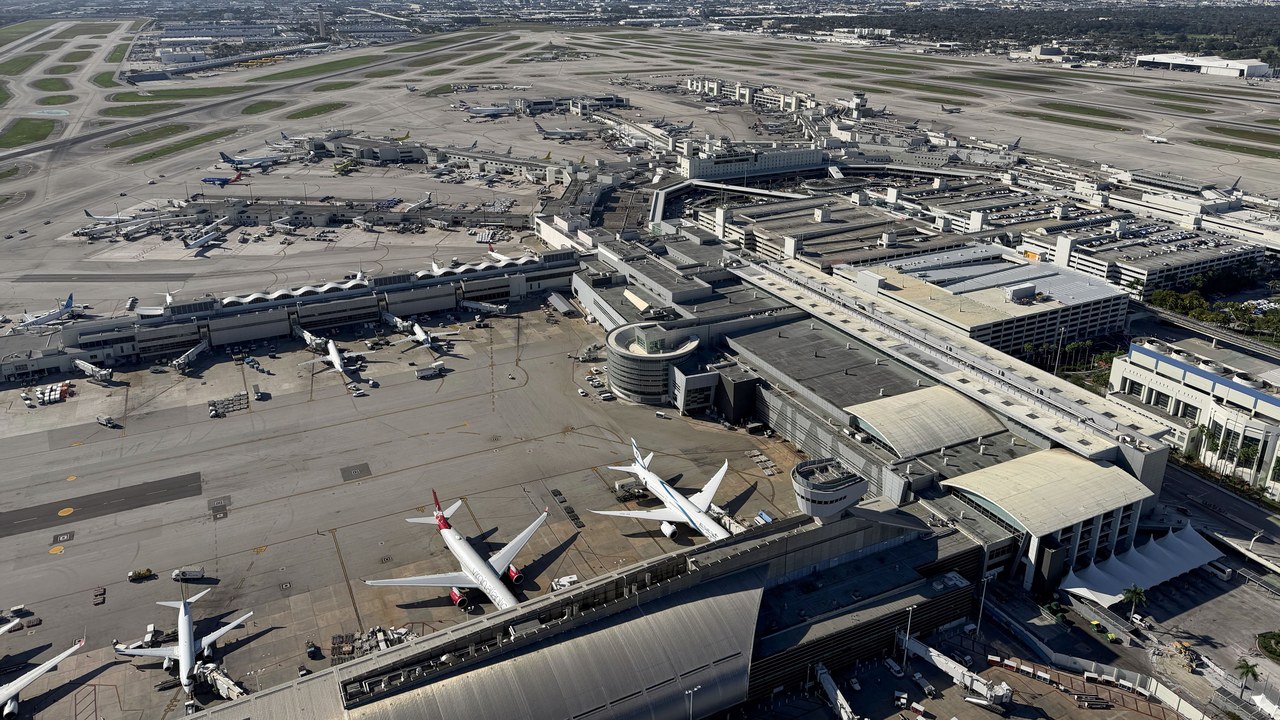
Miami ranked ninth in 2025 with 26,450,972 enplanements, based on Wikipedia’s busiest airports table. Only a small gap separates it from Las Vegas just above.
Rankings this close can shift from year to year, so a single year’s order should not be read as permanent. Anyone citing the number should note it comes from a reference table summarizing official data. Checking the FAA’s own table is the surest way to confirm the exact placement.
10. San Francisco International: A Rare Gain
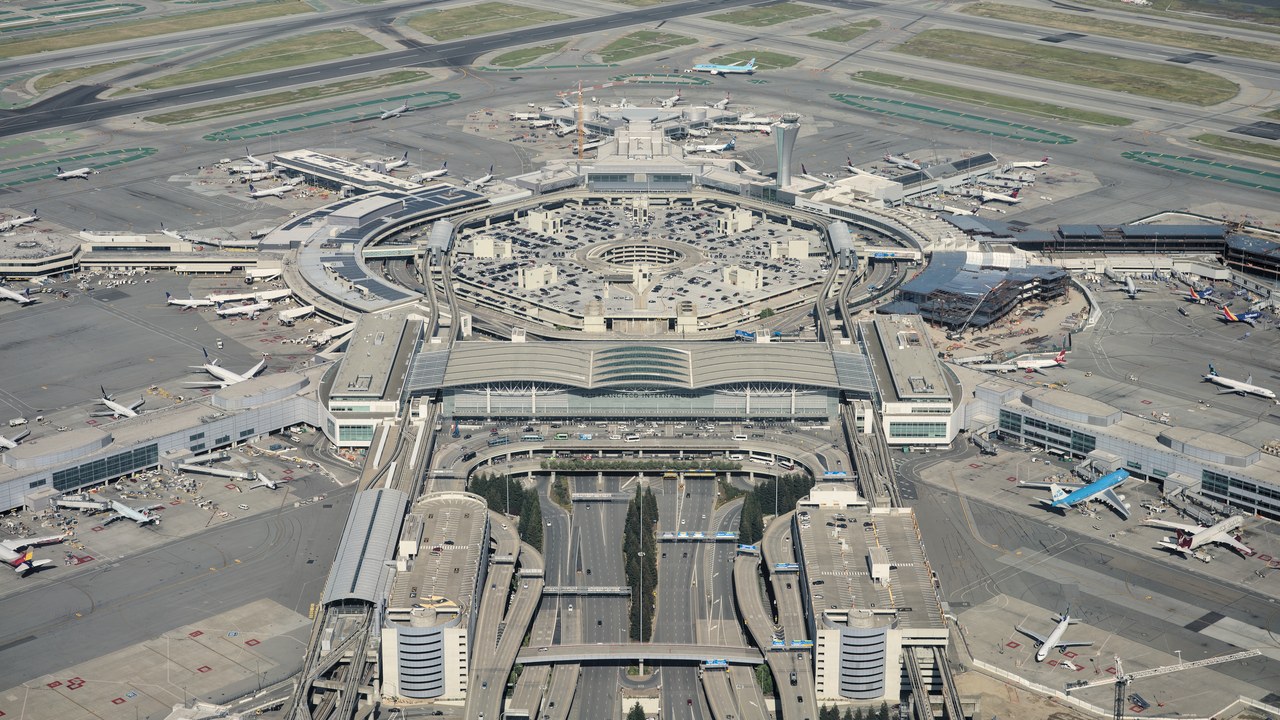
San Francisco ranked 10th in 2025 with 26,251,850 enplanements, up 4.68% from 25,078,968 the year before, according to FAA passenger boarding figures. That made it one of the few large hubs in this group to grow.
The increase stands out because several of the airports ranked above it lost passengers over the same period. The federal table reports totals rather than causes, so the figures show where traffic moved, not why. Travelers planning trips through the Bay Area can expect a busy terminal either way.
11. Charlotte Douglas International: Charlotte’s Big Drop
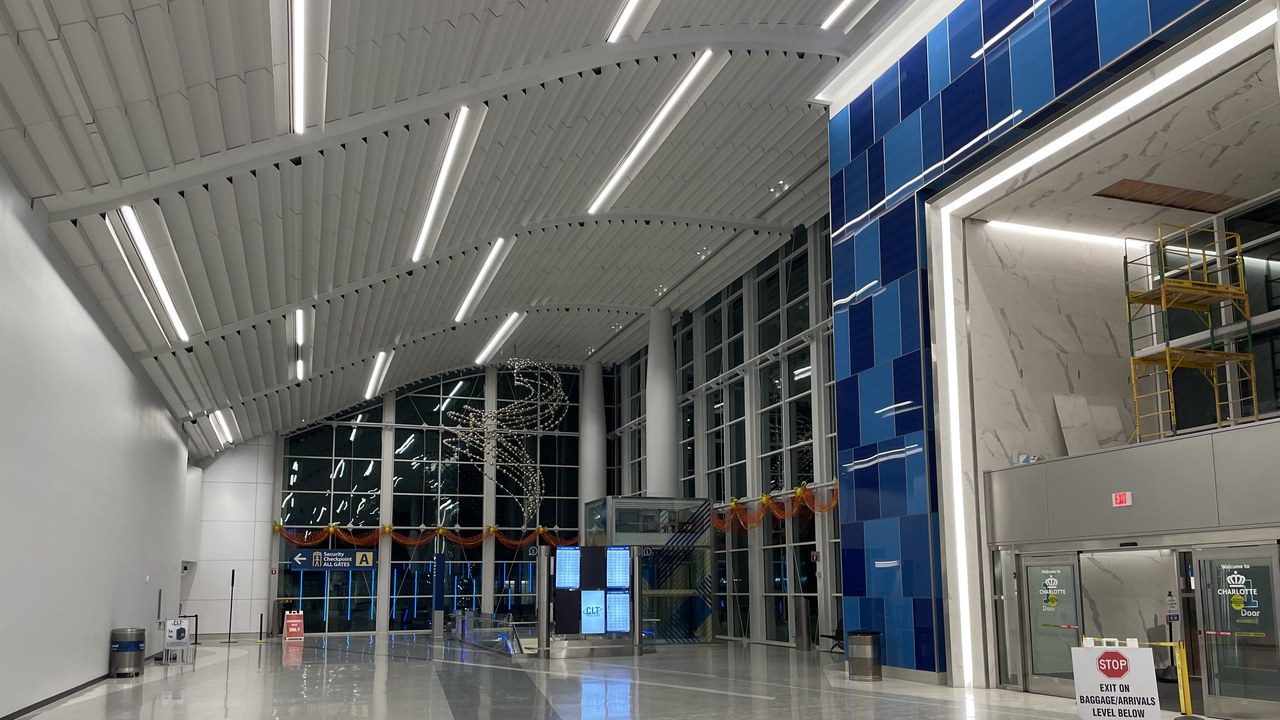
Charlotte fell 9.29% in 2025, from 28,523,822 to 25,873,555 enplanements, the sharpest drop among the top 15, according to the FAA enplanement data. It ranked 11th.
That decline of roughly 2.65 million boardings is the largest percentage change in this gallery. The data does not explain the cause, so readers should avoid assuming a reason beyond what airlines and airport officials state. Looking at several years of data would be needed to say whether the change is a trend.
12. Seattle-Tacoma International: Pacific Northwest Hub
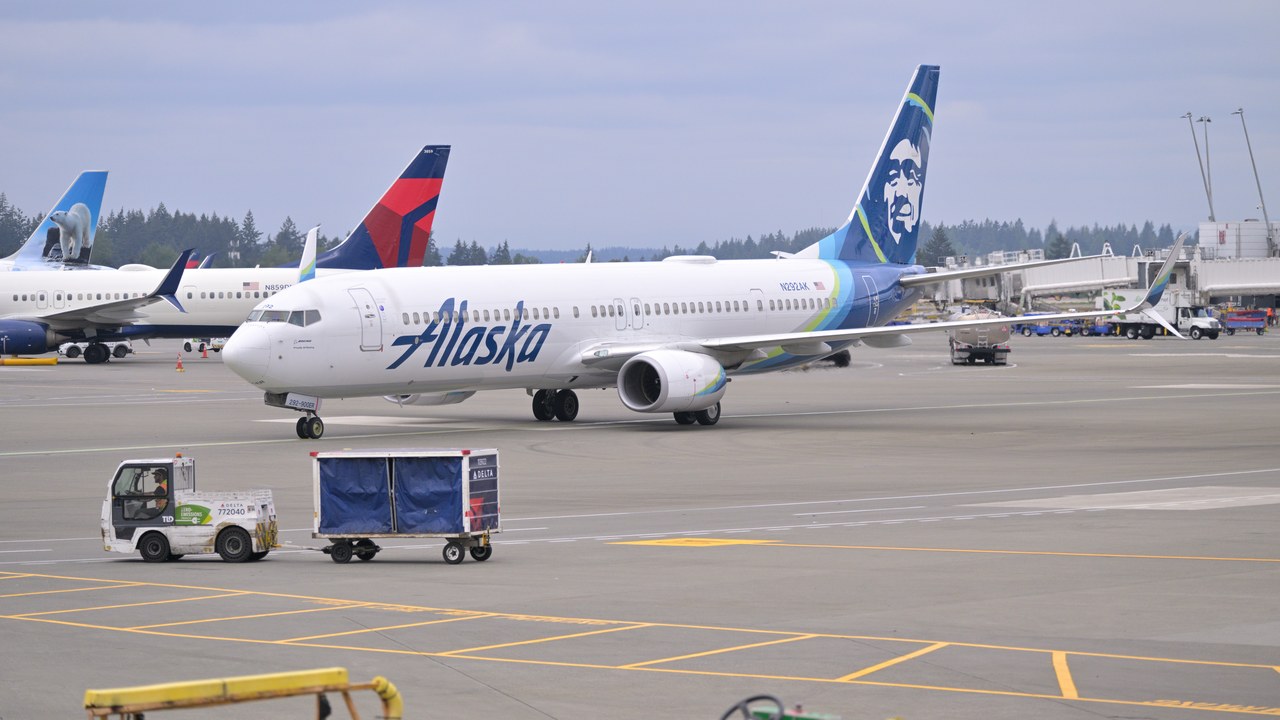
Sea-Tac ranked 12th in 2025 with 25,417,071 enplanements, per Wikipedia’s busiest airports list. It sits just below Charlotte and rounds out the top 12.
The figure is taken from a reference summary of the table, so checking the FAA publication is advisable for exact work. Travelers can use the total as a rough sense of scale, not a guide to crowding on any given day. Year-to-year changes at this size of airport can reflect many factors the table does not capture.
Help yourself and the planet: Get The Cool Down →
We may earn a commission if you sign up.
More from Morning Overview
- Neanderthals in Spain carved a wooden object that matches nothing archaeologists have ever found
- The FAA wants $2.39 million from a flight school it says flew a Cessna about 280 times with an unapproved part
- Shaq spent $1.3 million on three Rolls-Royce Phantoms to prove a point to a salesman
- Over 20 trillion gallons of rain fell on the Four Corners states and Nevada in two weeks
