
Land does not stay put where groundwater is pumped heavily, sediment is soft and buildings keep adding weight. Satellite radar and long survey records now let researchers track the drop in millimeters, and the results range from a few millimeters a year to more than a foot. Here are eight cities where the ground is measurably sinking.
1. Mexico City: Angel Monument Keeps Gaining Steps
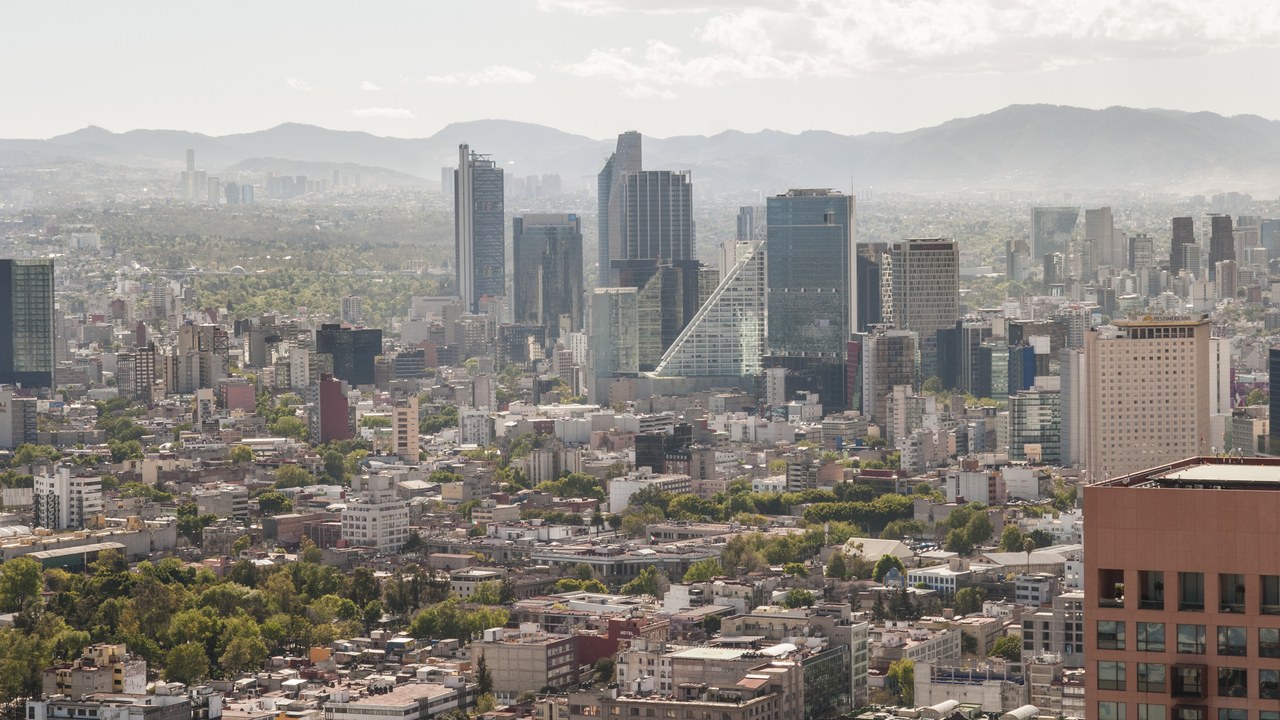
Satellite images show parts of Mexico City dropping up to 14 inches, or 35 centimeters, per year, according to Space.com’s satellite coverage. The Angel of Independence monument has needed 14 new steps since 1910 as the ground around its base fell.
The 14-inch figure applies to parts of the city, not all of it, so the rate differs from one neighborhood to the next. The added steps at the monument offer a visible, century-long gauge of how far the ground has moved. Across 48 coastal cities in a 2022 satellite study, the median rate was 16.2 millimeters a year, far below the Mexican capital’s fastest districts.
2. Jakarta: Two Meters Down Since 1900
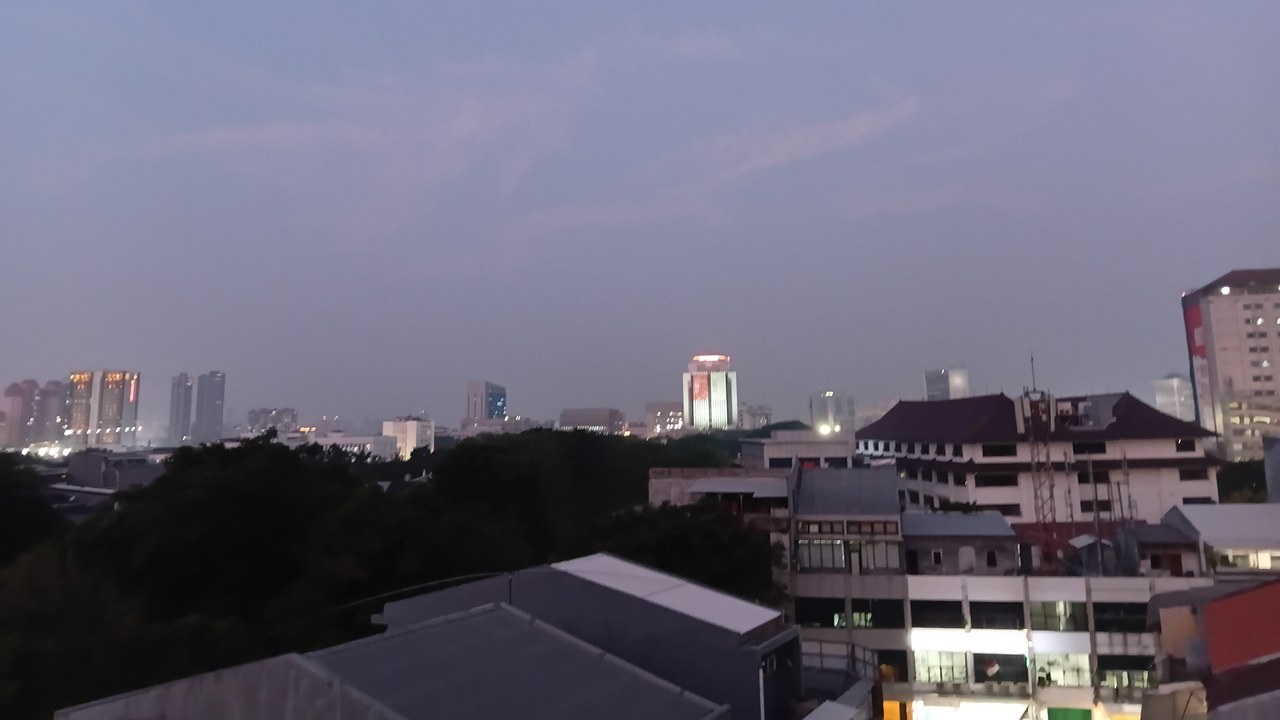
Jakarta sank about 2 meters, or 2,000 millimeters, between 1900 and 2013, and its current rate is 75 to 100 millimeters a year, according to Wikipedia’s sinking cities entry.
That current pace is several times the 16.2-millimeter median found in a 2022 study of 48 coastal cities, which also listed Jakarta among places sinking more than 20 millimeters in peak years. Land dropping this quickly leaves a coastal capital more exposed to rising seas. The 2,000-millimeter total covers 113 years, so it reflects a long accumulation, while the current rate describes how fast the drop continues today. The two numbers measure different things.
3. Bangkok: Sinking Faster Than the Gulf Rises
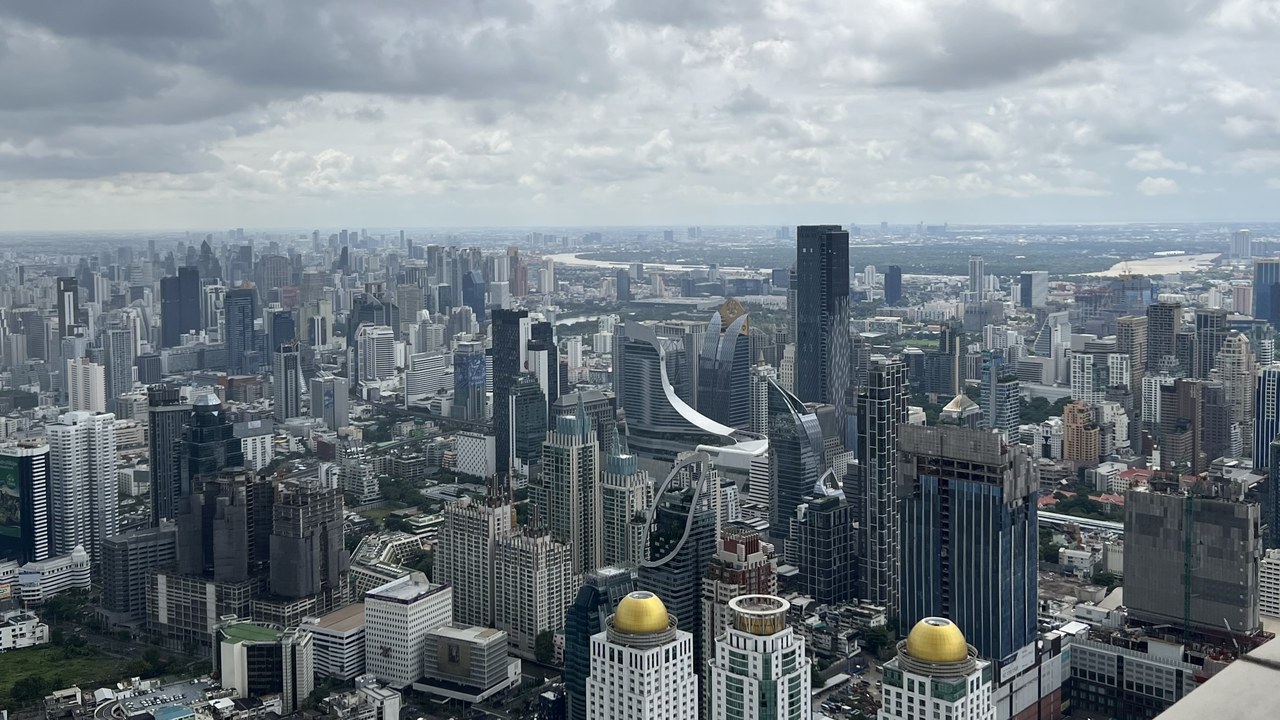
The Gulf of Thailand is rising about 0.25 centimeters a year, but Bangkok is sinking at a far faster rate, up to 4 centimeters a year, as summarized in a Wikipedia overview of subsidence.
Put another way, the land is dropping as much as sixteen times faster than the water beside it is climbing. The sea-level number alone therefore understates the problem, since ground movement accounts for most of the change in the city’s relative elevation. The 16.2-millimeter median from the 2022 48-city study makes Bangkok’s upper-end rate roughly two and a half times that typical figure, though 4 centimeters is a maximum rather than a citywide average.
4. New Orleans: A Century of Slow Settling
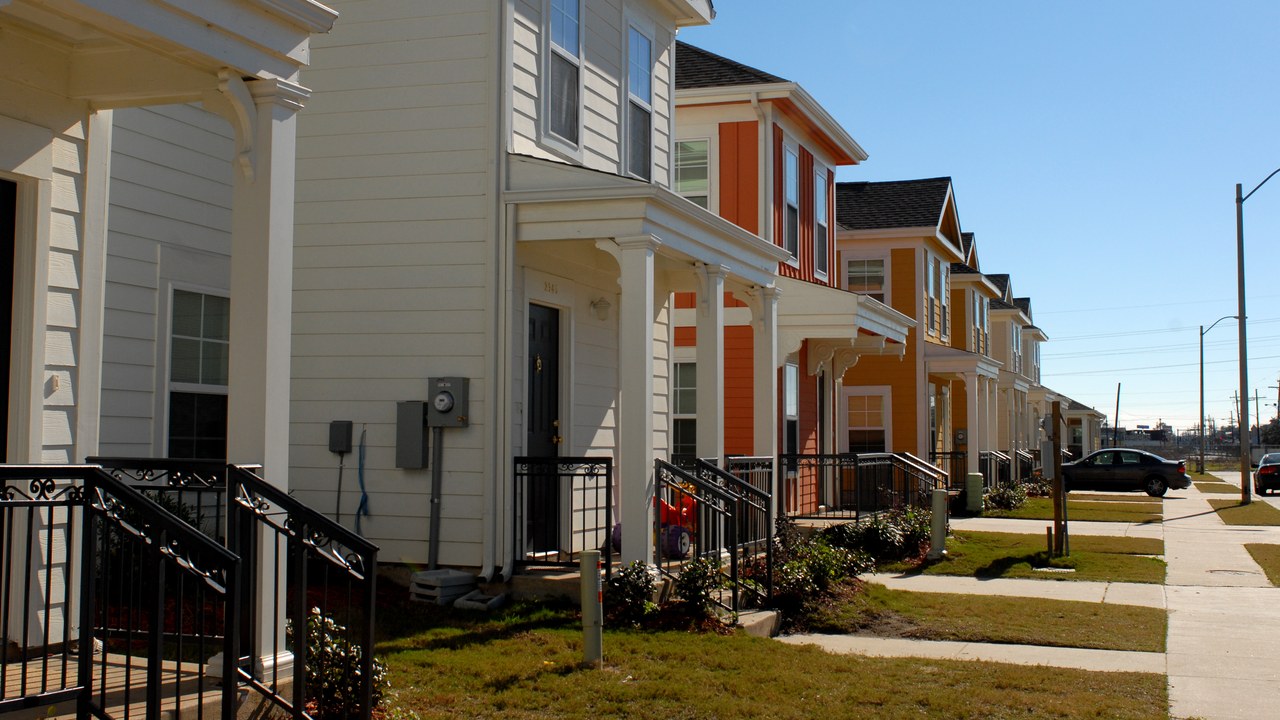
New Orleans has sunk about 1,130 millimeters between 1900 and 2013 and is still dropping about 6 millimeters a year, according to a Wikipedia subsidence table.
The annual rate looks small beside Jakarta’s, yet the century-scale total exceeds a meter and keeps growing. For homeowners and flood planners, that long accumulation is the more useful number, because it shows how much elevation the city has already lost. By comparison, a study of 28 major American cities found rates of 2 to 10 millimeters a year, so New Orleans’ current rate falls inside that range while its long-term total is far larger.
5. Houston: Worst Case Among American Cities
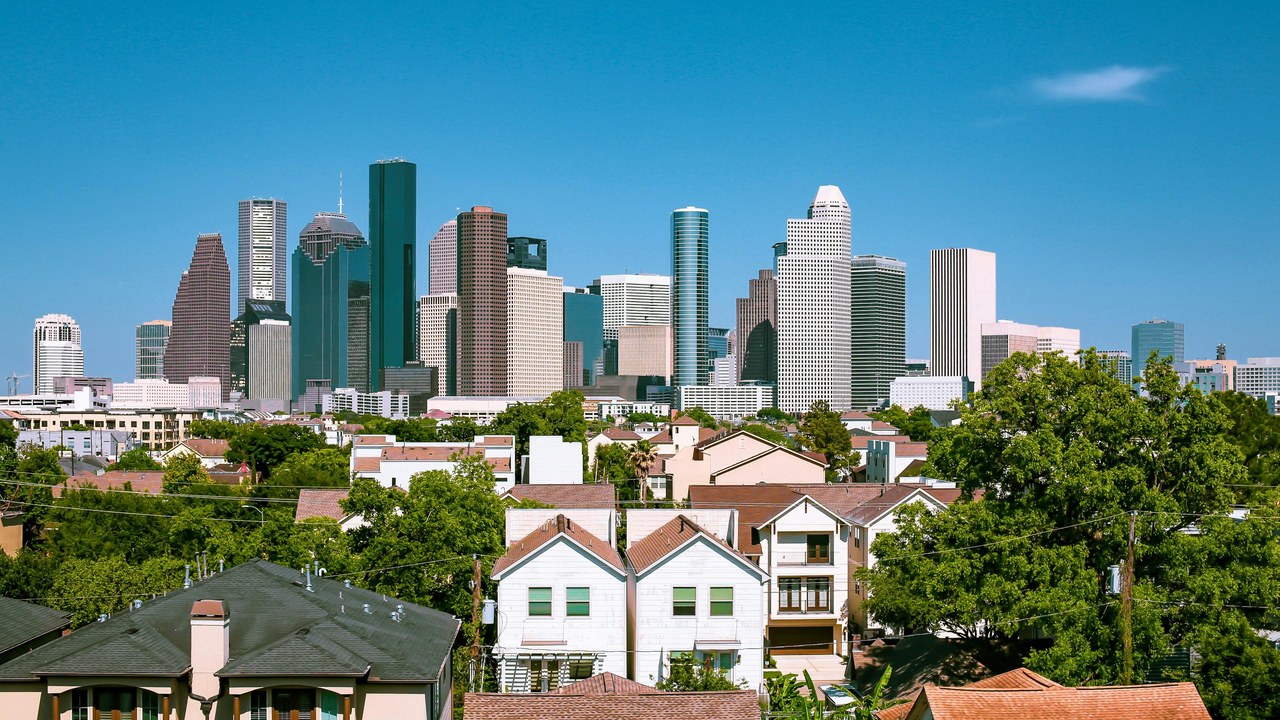
Houston showed the most severe subsidence among 28 major American cities examined in Virginia Tech’s study summary, with some areas sinking more than 20 millimeters annually.
That is at least double the top of the 2-to-10-millimeter range found across the 28 cities, which together hold 34 million people and where groundwater extraction was the main cause. The 20-millimeter figure describes particular areas rather than the entire metro region. Twenty millimeters is roughly four-fifths of an inch a year, small on any single day but sizable over decades for roads, pipes and foundations.
6. New York City: Slow Sinking Near LaGuardia
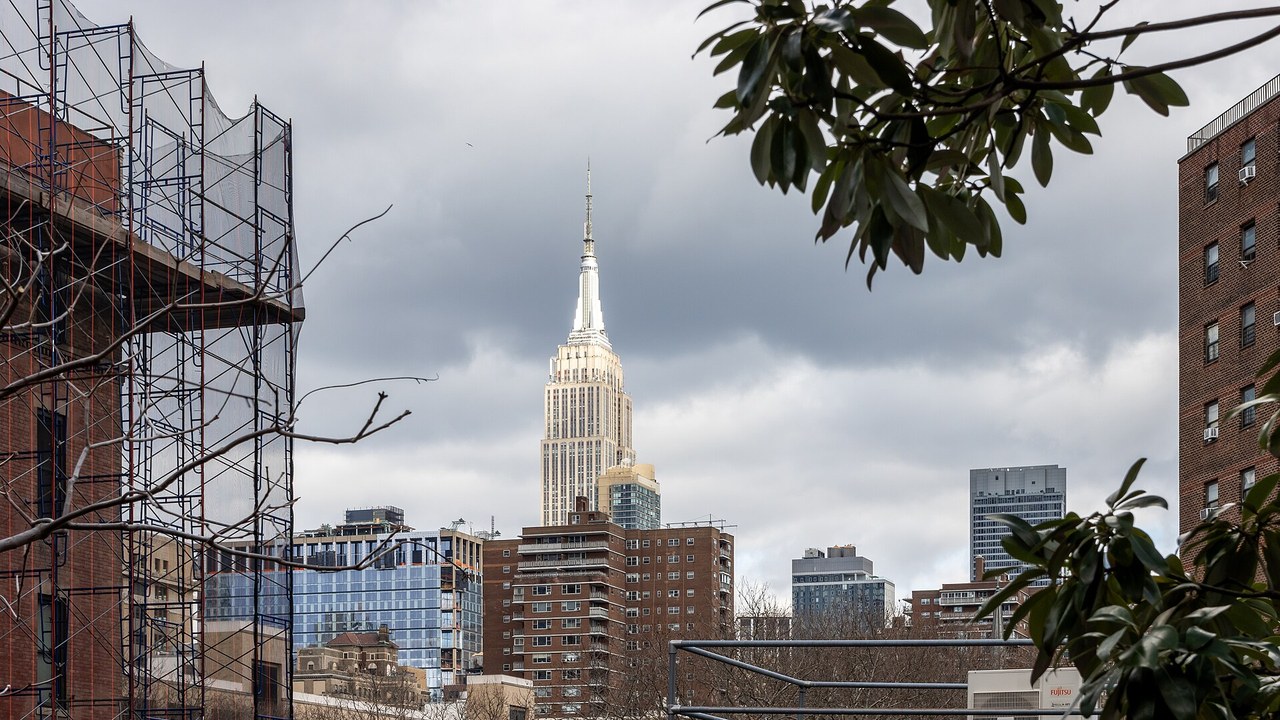
Much of New York City is slowly sinking, at about 2 millimeters a year, with hot spots around LaGuardia Airport, according to a university research summary.
The figure sits at the low end of the study’s 2-to-10-millimeter range, which makes the city a milder case than Houston. The hot spots show that the rate varies within a single metropolitan area, so a citywide average can hide sharp local differences. The hot spots around the airport are the specific detail the study names for the city, which makes that area the natural focus for anyone tracking infrastructure effects.
7. Ho Chi Minh City: Fastest in a 48-City Study
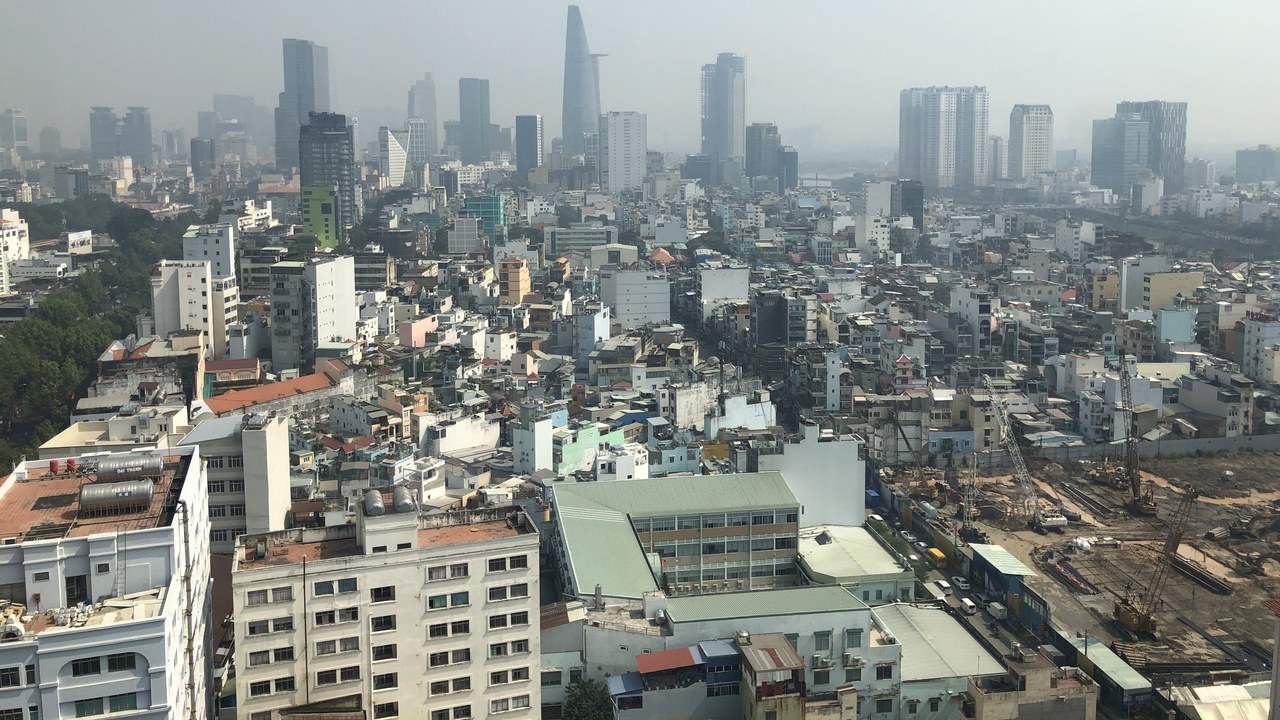
Ho Chi Minh City topped a satellite study of 48 coastal cities, sinking an average of 16.2 millimeters, or 0.6 inches, a year, according to Phys.org’s study coverage.
The 16.2-millimeter figure matches the median cited for the 48-city study as a whole, while the fastest individual locations reached 43 millimeters a year. For a coastal city, even the average rate steadily erodes the margin against floodwater. The study appeared in Nature Sustainability on September 20, 2022, and its satellite approach lets every city be compared on one consistent measure of sinking.
8. Yangon: Peak Years Topped 20 Millimeters
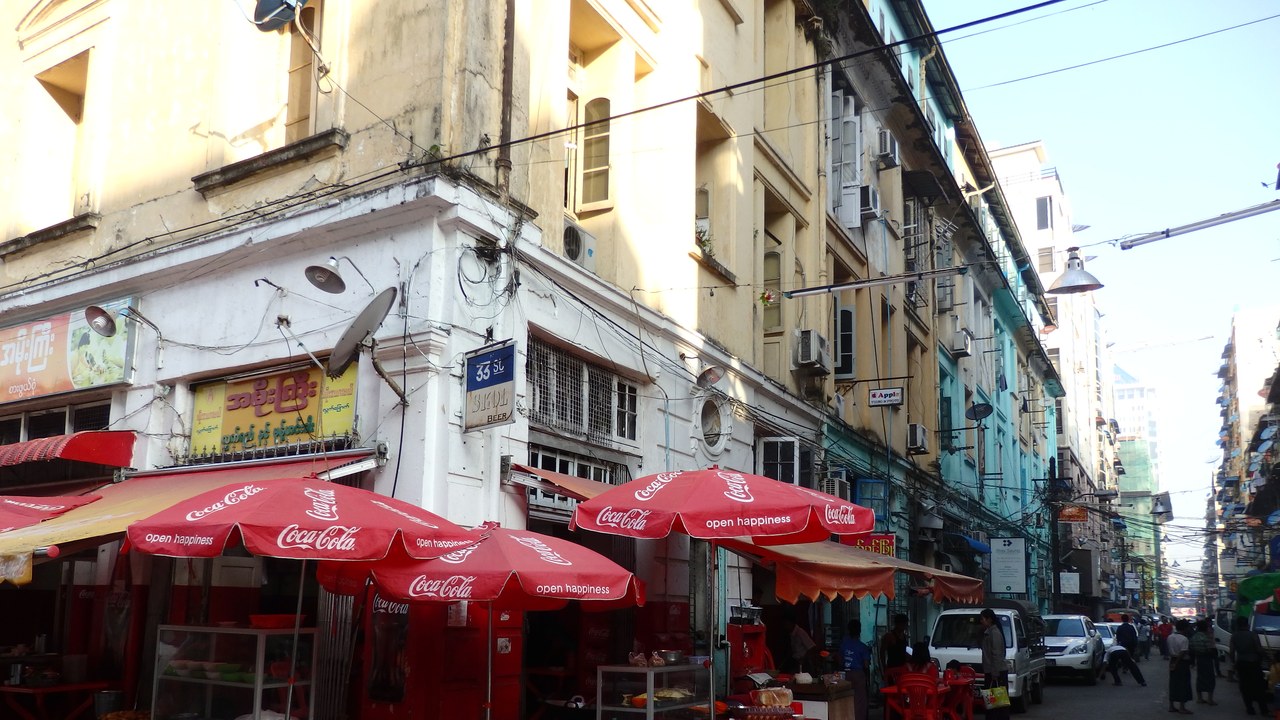
Yangon, Myanmar’s commercial hub, was sinking more than 20 millimeters in peak years, alongside Ahmedabad and Jakarta, according to a 2022 satellite-study report covering 48 coastal cities.
Peak-year figures describe the fastest stretches rather than a steady annual average, so the study’s 16.2-millimeter median sits well below them. Even so, 20 millimeters a year would add up to nearly eight inches over a decade if sustained. The study’s maximum was 43 millimeters a year, so Yangon’s peak-year rate does not represent the study’s extreme. The findings appeared in Nature Sustainability in September 2022.
More from Morning Overview
- Supplements now rank as the fifth-leading cause of death from liver disease.
- Herbal supplements are landing Americans in the hospital with liver damage, doctors warn
- General Motors is switching on cameras that record inside your vehicle by update
- A geomagnetic storm is forecast to hit Earth today, pushing the northern lights unusually far south
