
Hurricanes that strike the American coast can leave bills that run into the tens of billions of dollars. Damage totals come from different sources and are stated in different years’ dollars, so each entry notes where its figure comes from. Here are twelve of the costliest, with Katrina and Harvey tied at the top.
Help yourself and the planet: The Cool Down makes it easy to help yourself while helping the planet, with smart, simple changes to save more and waste less in your everyday life.
We may earn a commission if you sign up.
1. Hurricane Katrina (2005): Tied at the Top
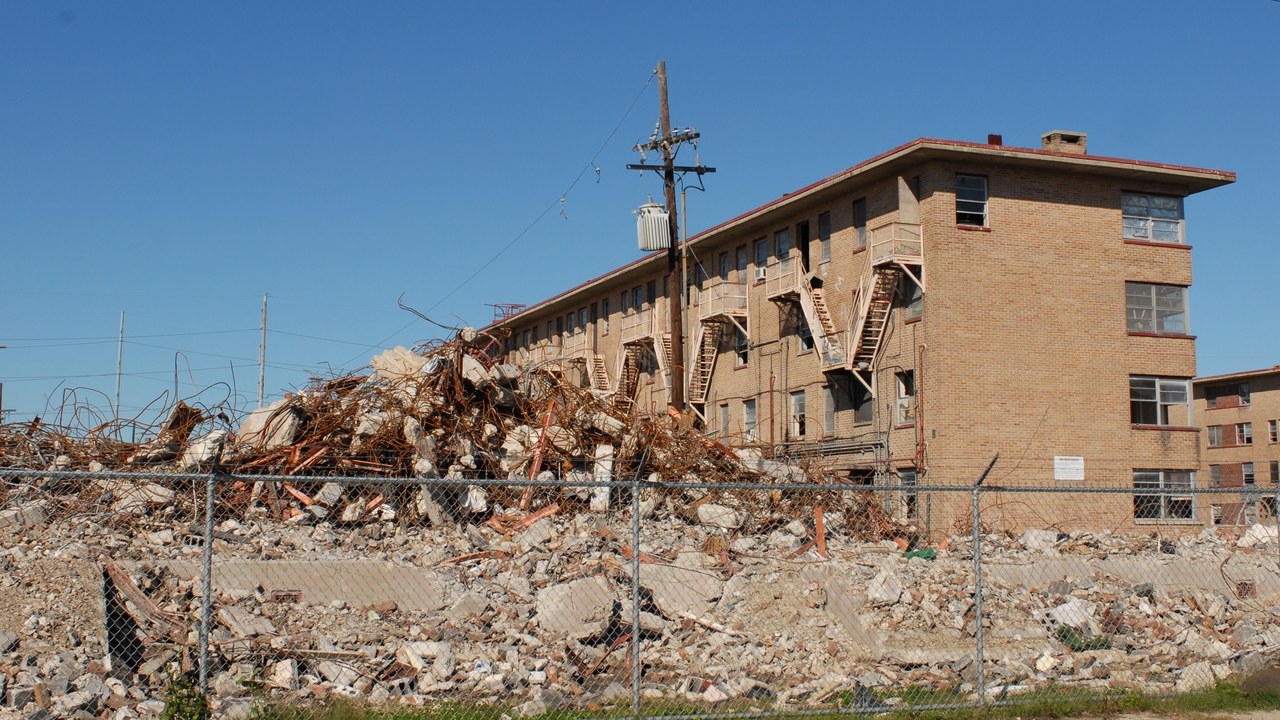
Hurricane Katrina is credited with an estimated $125 billion in damage, or $206 billion when adjusted for inflation, according to its Hurricane Katrina damage estimate. The inflation-adjusted number is the larger of the two.
That nominal total ties it with Harvey as the costliest storm in NOAA’s table. The two sit at the top of this list, and the gap between the nominal and inflation-adjusted numbers shows how much a dollar amount depends on the year it is measured.
2. Hurricane Harvey (2017): Tied With Katrina
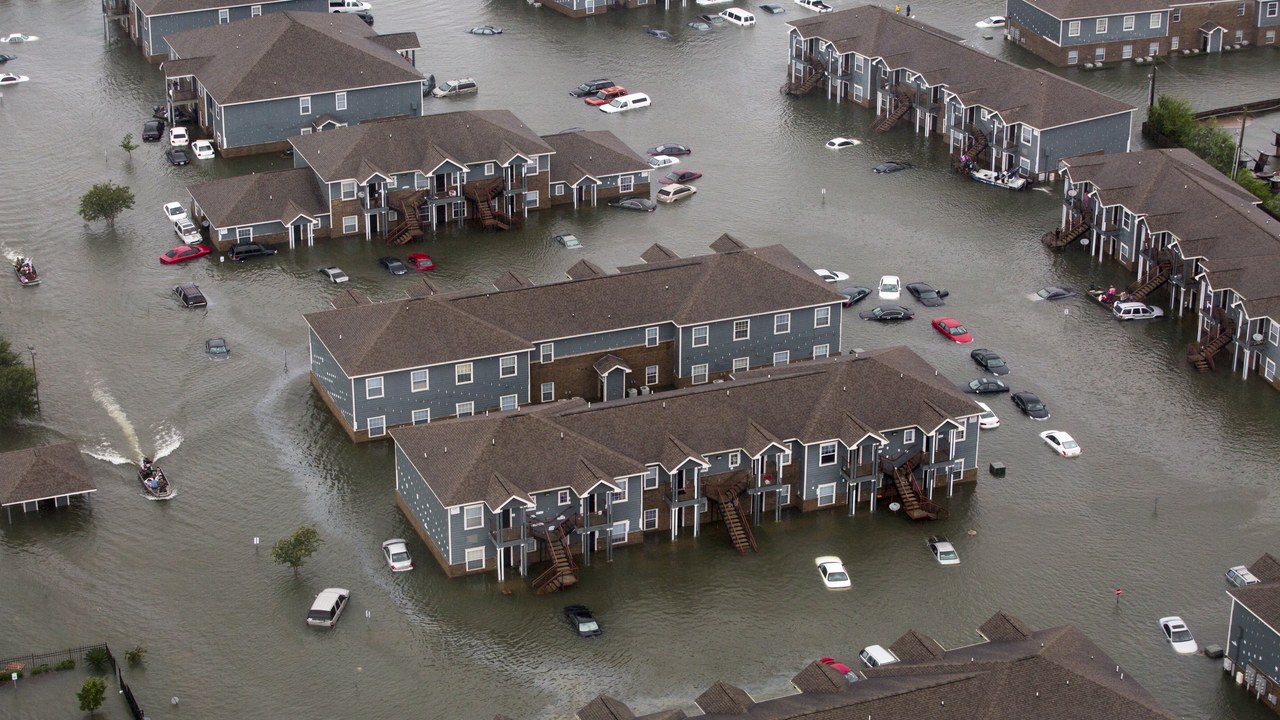
Hurricane Harvey also totals $125 billion in damage, with a 90% confidence interval of $90 billion to $160 billion, as laid out in the Hurricane Harvey damage estimate. That puts it level with Katrina at the head of the ranking.
The wide range is a reminder that such totals are estimates rather than exact tallies. Even so, the central figure matches Katrina’s, and that tie is the reason the two storms share the top spot in this gallery’s headline.
3. Hurricane Ian (2022): Florida’s Costliest
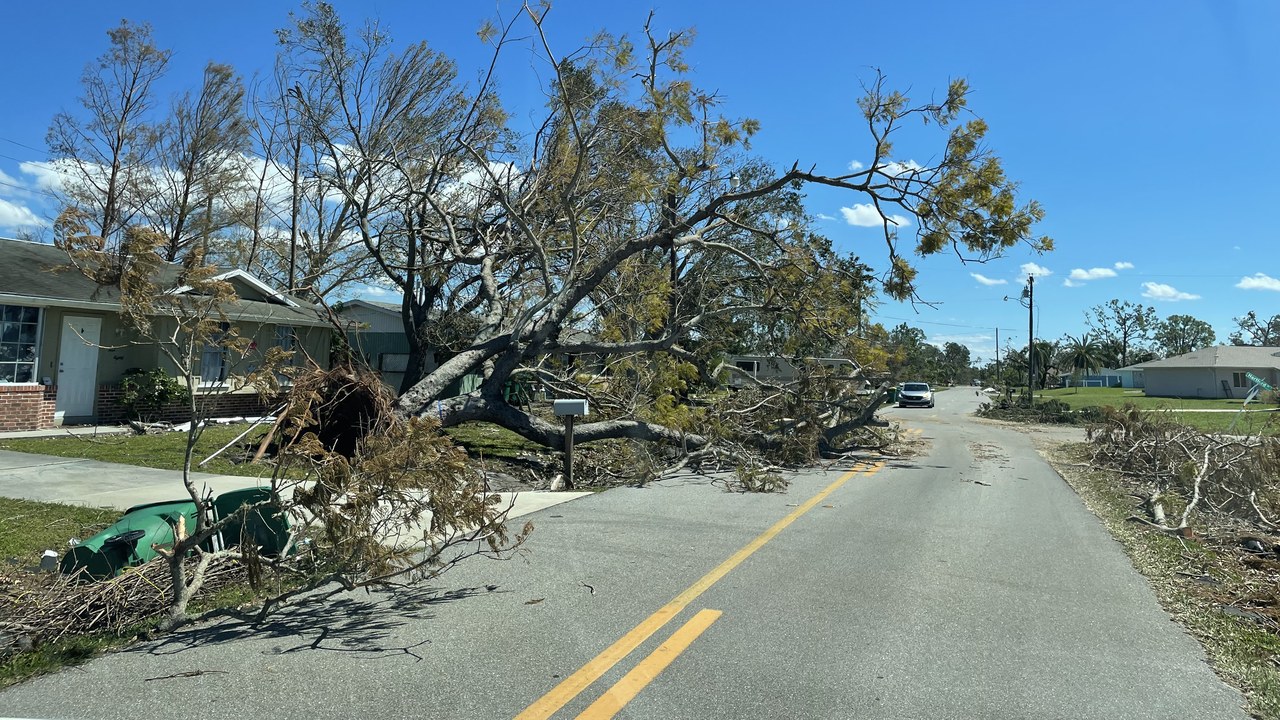
Hurricane Ian caused $112 billion in damage in 2022 dollars, and its Hurricane Ian damage figure calls it the costliest in Florida history. The same page lists it as the third-costliest tropical cyclone on record.
Because the figure is stated in 2022 dollars, it is not directly comparable with older storms listed as nominal totals. Even with that caveat, Ian ranks just behind the Katrina and Harvey pair and well ahead of every other storm here.
4. Hurricane Maria (2017): Island Losses
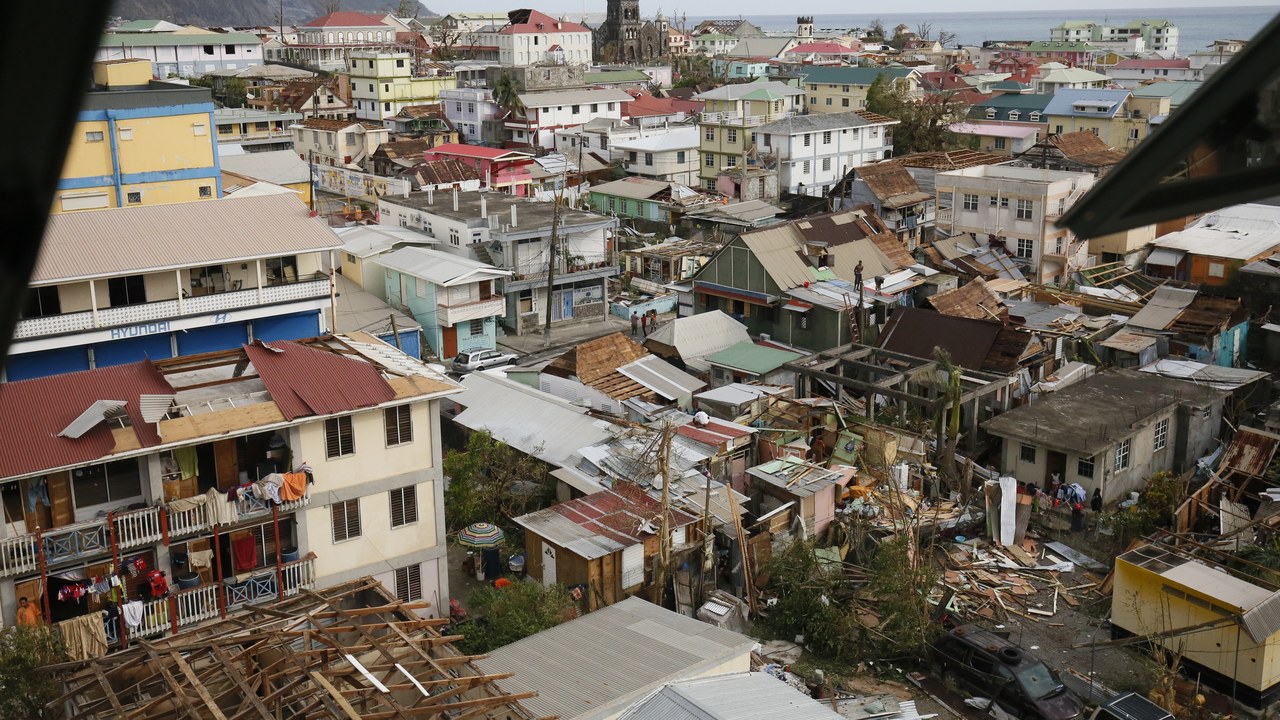
Hurricane Maria’s total monetary losses are estimated at upwards of $91.61 billion in 2017 dollars, according to the Hurricane Maria loss estimate. Those losses were recorded in Puerto Rico and the Virgin Islands.
That places the storm fourth on this list, behind Ian. The figure reads as an estimate and a floor, since the source phrases it as upwards of that amount, and it is stated in the dollars of the storm’s own year.
5. Hurricane Helene (2024): Deadly Inland Reach
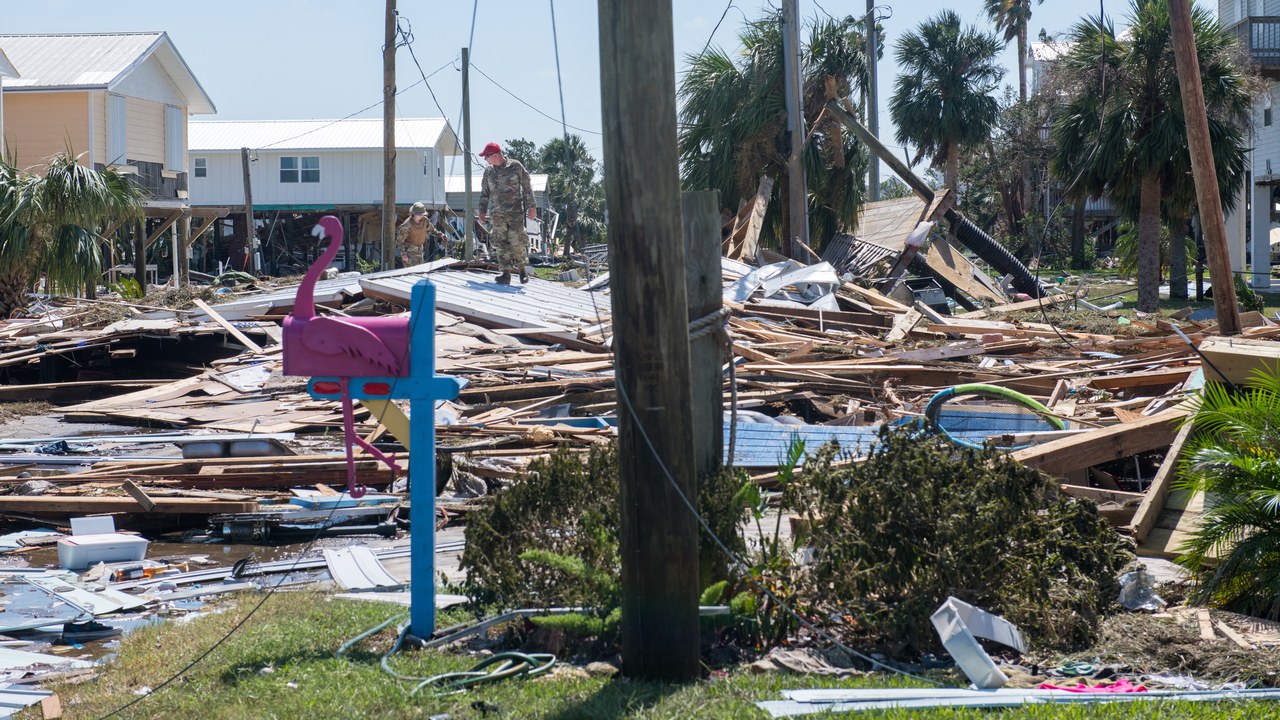
Hurricane Helene caused an estimated $78.7 billion in damage in the United States, according to the National Hurricane Center’s Helene damage report. The storm also brought at least 175 direct deaths.
That toll makes it the deadliest hurricane on the mainland since Katrina. Its damage figure is stated in 2024 dollars, the most recent of any storm listed here, and it ranks fifth in this ordering, just ahead of Irma and Ida. Its mainland death toll is part of why it stands out beyond the dollar figure.
6. Hurricane Irma (2017): Statewide Sweep
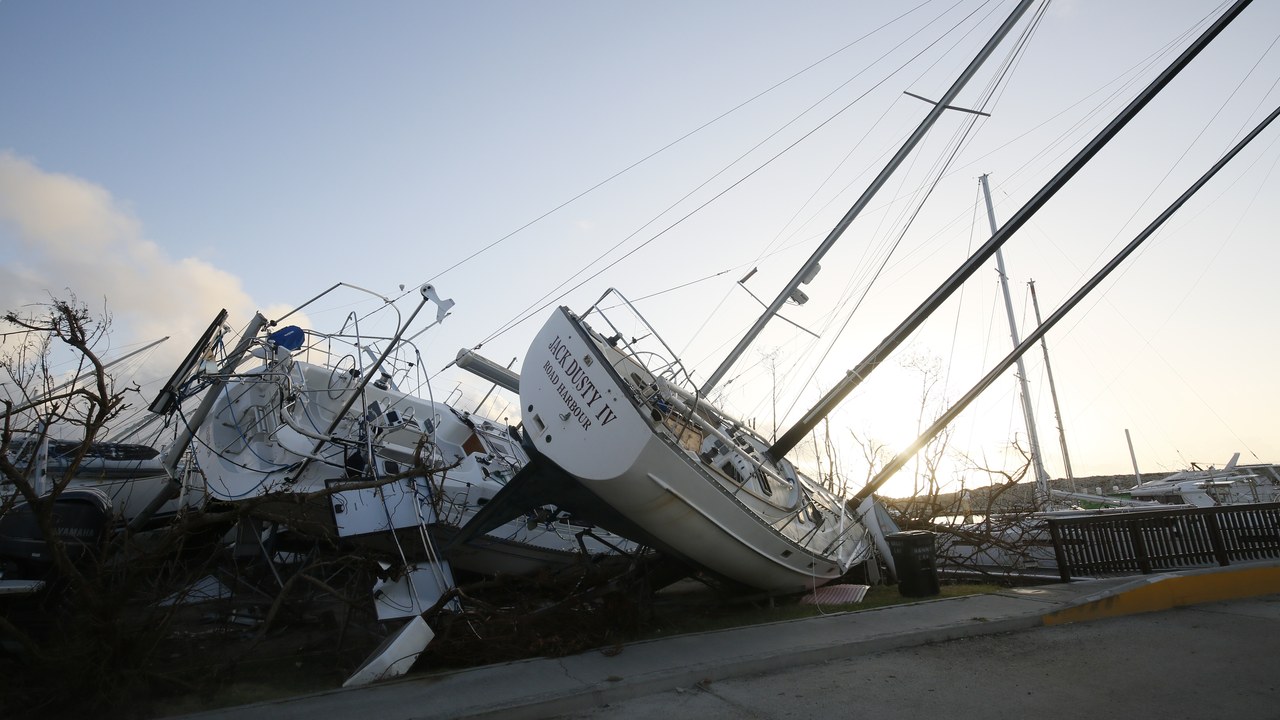
Hurricane Irma caused $77.2 billion in total damage in 2017 dollars, as recorded in its Hurricane Irma damage total. That total ranks sixth on this list, just behind Helene.
Irma and Ida land within about two billion dollars of each other, so small revisions to either estimate could shuffle their order. The source frames the amount as total damage, measured in the dollars of the storm’s own year. That detail matters when comparing it with the older, nominal figures elsewhere on the list.
7. Hurricane Ida (2021): Louisiana Landfall

Hurricane Ida is described as having caused at least $75.25 billion in damages in 2021 dollars, according to its Hurricane Ida damage total. That puts it seventh in this ordering, just behind Irma.
The phrase at least signals that the total could rise as later assessments come in. As it stands, Ida finishes only a little ahead of Sandy, which rounds out the group of storms near the $70 billion mark.
8. Hurricane Sandy (2012): Northeast Surge

Hurricane Sandy inflicted nearly $70 billion in damage across the Mid-Atlantic and Northeast, according to its Hurricane Sandy damage estimate. The storm struck in 2012 and ranks eighth on this list.
Its figure sits just below Ida’s and well above the next entry, Ike, at $30 billion. The word nearly in the source means the total falls a little short of the round number rather than exceeding it. That makes the entry a close call against Ida, which the source describes as at least $75.25 billion.
9. Hurricane Ike (2008): Gulf Coast Category 2
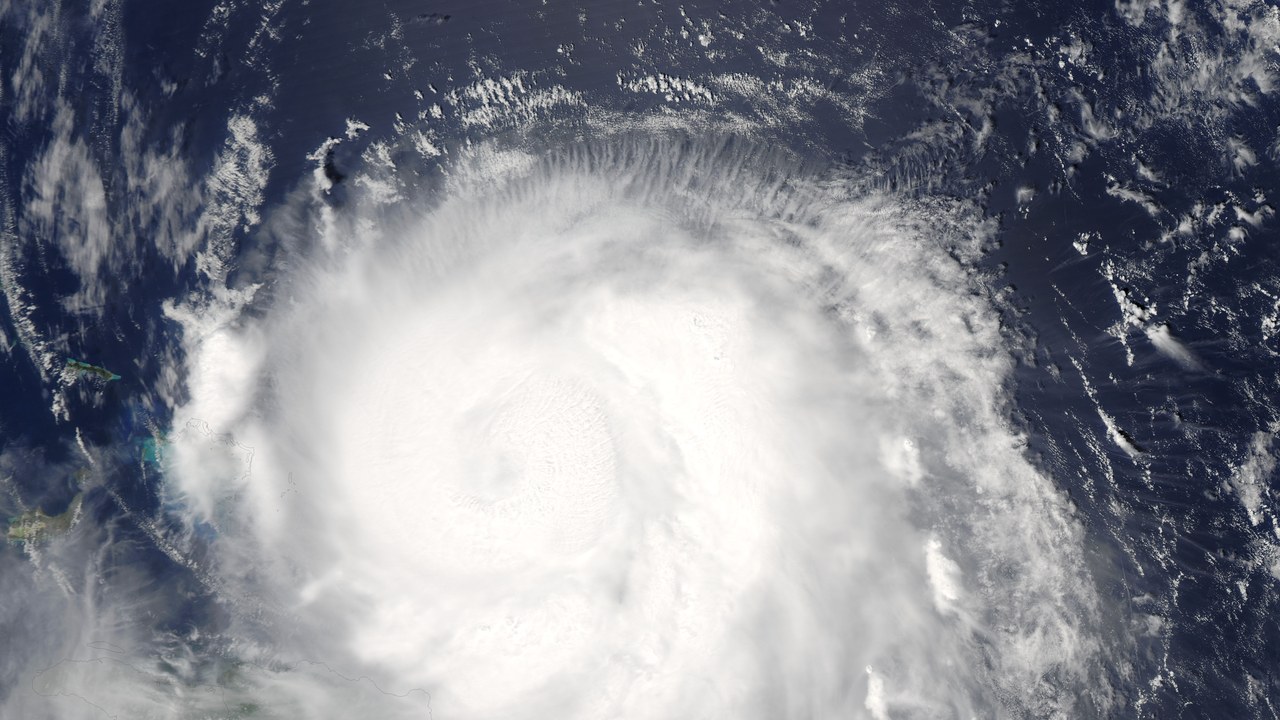
Hurricane Ike is listed at $30 billion for Texas and Louisiana, and the NOAA costliest-hurricanes table classes it as a Category 2 storm. That is less than half of Sandy’s nearly $70 billion.
The drop from Sandy to Ike marks a sharp break in the ranking. That table was compiled in January 2018, so its dollar values are nominal figures from that update rather than inflation-adjusted amounts. The entry also names only Texas and Louisiana as the affected area.
10. Hurricane Ivan (2004): Panhandle Pounding
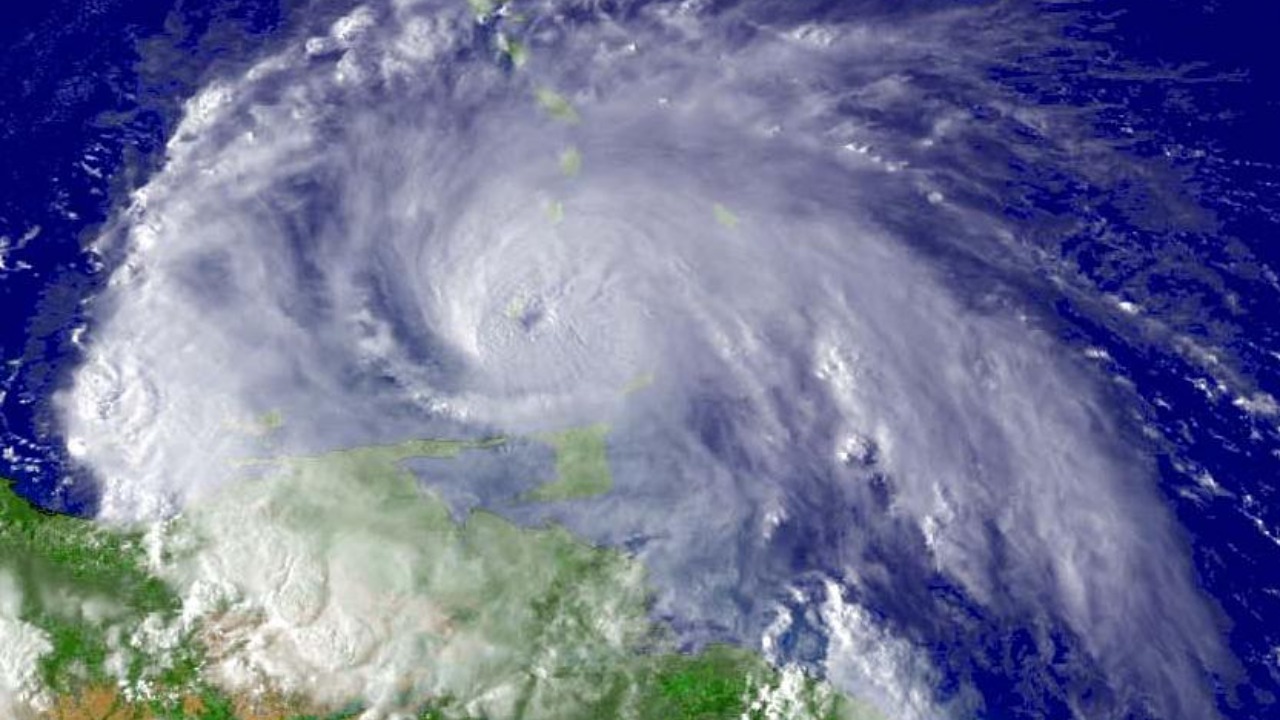
Hurricane Ivan is tallied at $20.5 billion along Alabama and the Florida Panhandle in the NOAA costliest-hurricanes table. It struck in 2004 and is rated Category 3 in that table.
Its total sits only slightly above the next two entries, which shows how closely the lower ranks are bunched. As with Ike, the figure is a nominal amount from the January 2018 update rather than an inflation-adjusted one. The affected area is given as Alabama and the Florida Panhandle in the same entry.
11. Hurricane Wilma (2005): South Florida Strike
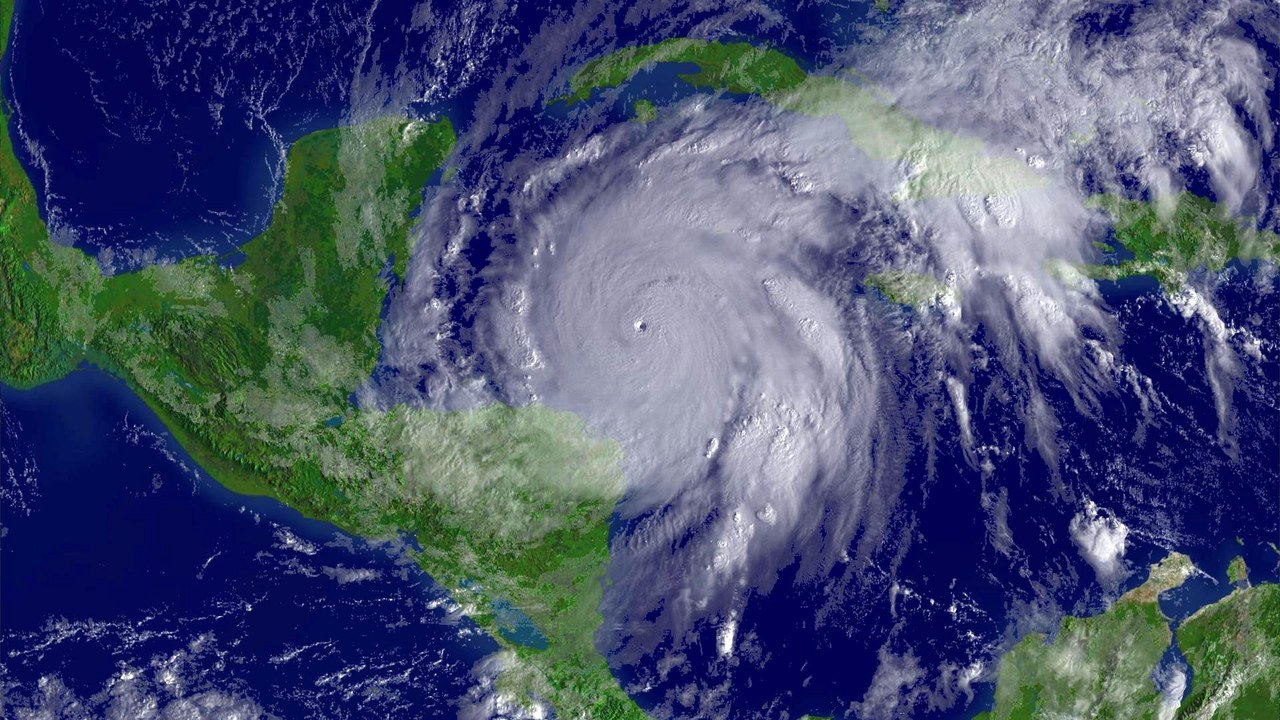
Hurricane Wilma is listed at $19 billion in South Florida, a Category 3 storm from 2005 in the NOAA costliest-hurricanes table. The figure trails Ivan’s by only $1.5 billion.
Wilma is one of three 2005 storms on this list, a reminder of how costly that single season proved to be. Like Ivan and Ike, it comes from the January 2018 table, so the amount is a nominal figure. The entry limits the damage area to South Florida.
12. Hurricane Rita (2005): Border Region Blow
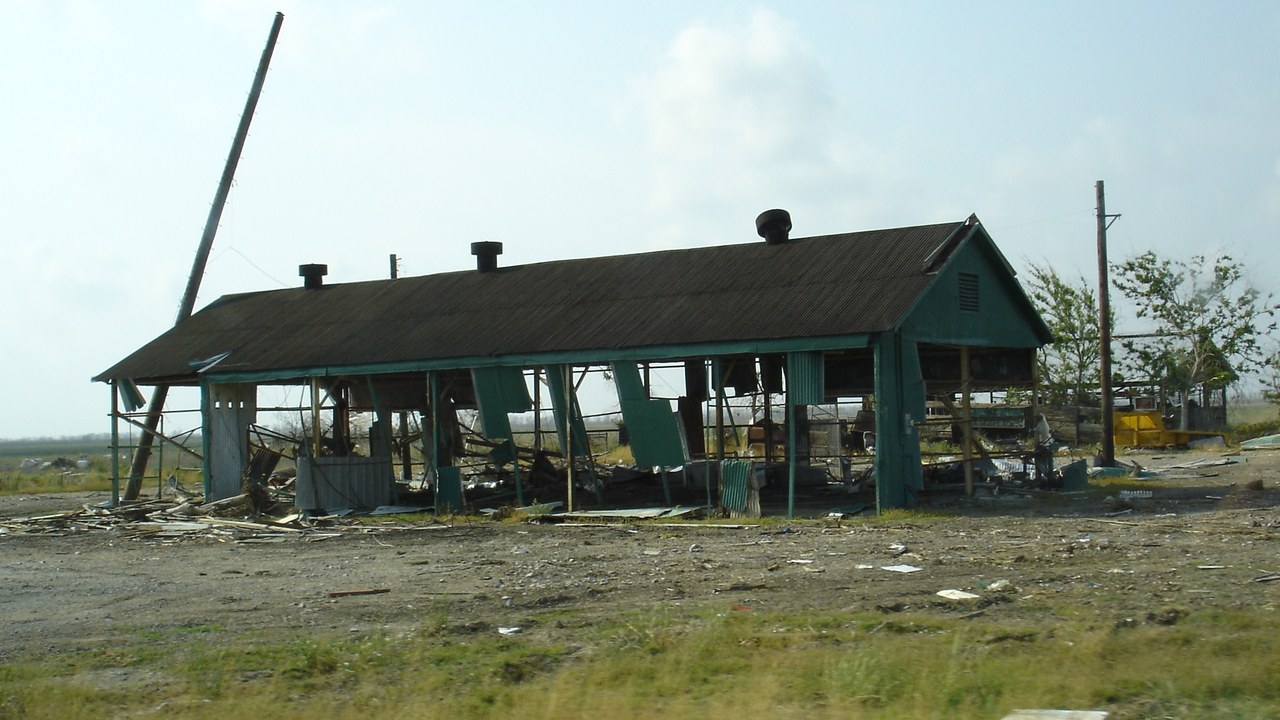
Hurricane Rita is listed at $18.5 billion for southwest Louisiana and north Texas, according to the NOAA costliest-hurricanes table. The 2005 storm closes out the list and is the third from that season to appear.
Its entry carries a Category 3 rating in the same January 2018 table that supplies the Ike, Ivan and Wilma figures. Together with Katrina and Wilma, Rita shows how one season produced three of the twelve costliest storms here.
Help yourself and the planet: Get The Cool Down →
We may earn a commission if you sign up.
More from Morning Overview
- Long use of a common prostate pill is tied to a higher chance of glaucoma
- Ford is recalling 223,472 F-150 pickups because the fuel tank can leak or detach
- Hybrids have 15% fewer problems than gas cars, while EVs and plug-in hybrids have about 80% more, Consumer Reports finds
- Regulators cleared the first U.S. small modular reactor, 4 months early
