
American rapid transit spans old municipal subways, elevated lines and newer regional networks, and the systems count their riders in very different ways. Some are measured by annual trips, others by weekday boardings, and a few are better known for their history than their volume. Here are eleven systems, each with the figure or fact that explains its place.
1. New York City Subway: A Billion-Trip System
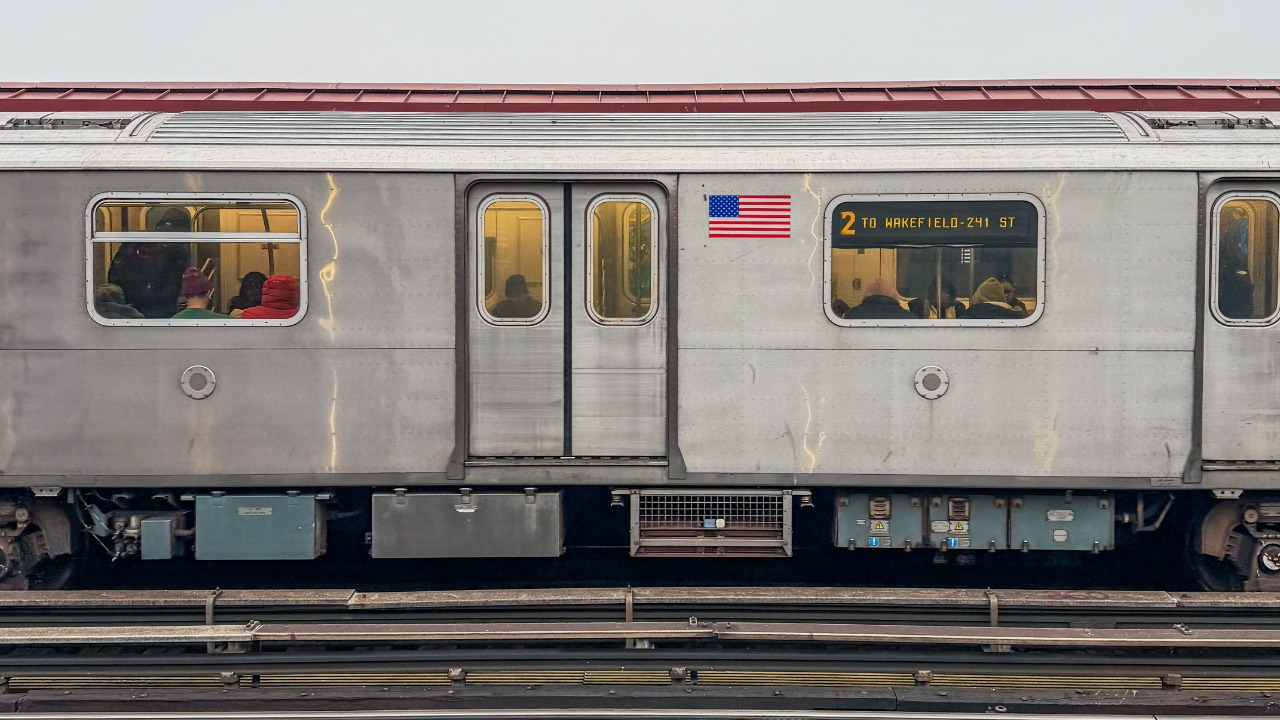
The New York City Subway had a daily ridership of approximately 3.4 million in 2024 and an annual ridership of 1.2 billion, according to the MTA’s description of New York City Transit.
Those totals are the reason the system anchors any comparison of American rapid transit. The daily and annual figures describe 2024 specifically, so they work as a benchmark for that year and not as a permanent measure of the network. At 1.2 billion annual trips, New York’s total is more than six times the Washington Metro’s 188,549,700 for 2025, though the years differ.
2. Washington Metro: Second Place by Trips
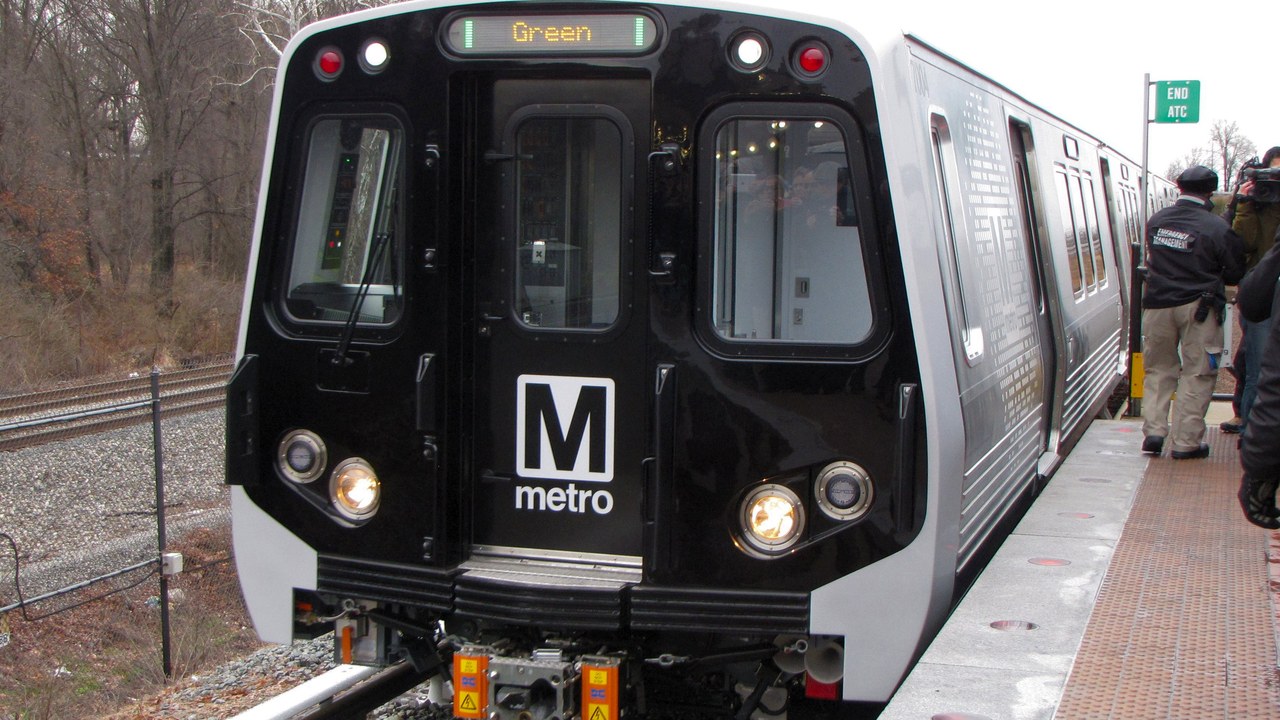
The Washington Metro recorded 188,549,700 trips in 2025, about 675,100 per weekday as of the second quarter of 2026. Wikipedia ranks it second among heavy rail rapid transit systems in the United States by passenger trips, behind New York.
The weekday figure comes from a different period than the annual one, so the two numbers are best read separately. Second place is measured by number of passenger trips, which is a different test from track length or station count.
3. Chicago “L”: A Million Weekday Rides
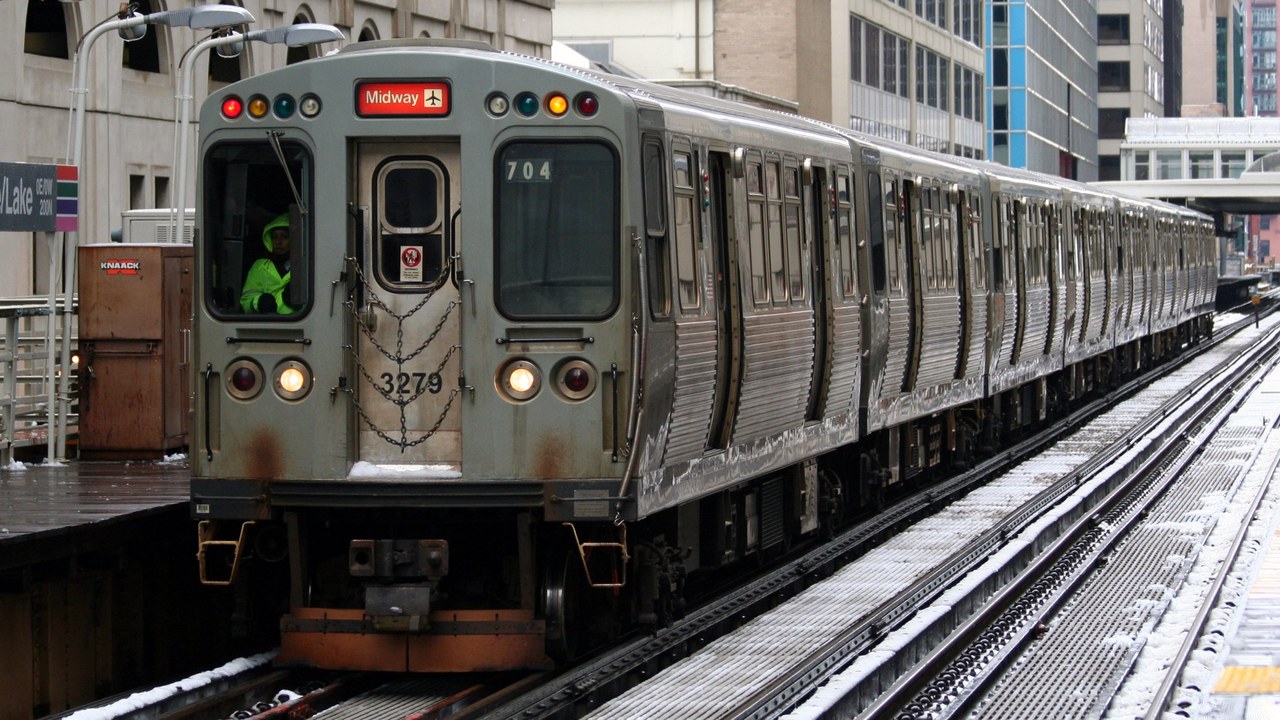
Chicago Transit Authority figures put an average weekday at 1,042,505 rides taken on CTA. The count covers the agency as a whole, rail and bus together, so it is not a measure of the “L” alone.
Anyone comparing it with the subway-only totals elsewhere on the list should keep that difference in mind, since the Chicago number includes bus rides. That weekday count is higher than the Washington Metro’s 675,100 per weekday, but the Chicago figure includes buses and so is not a like-for-like comparison.
4. Bay Area Rapid Transit: A Bond for 71.5 Miles
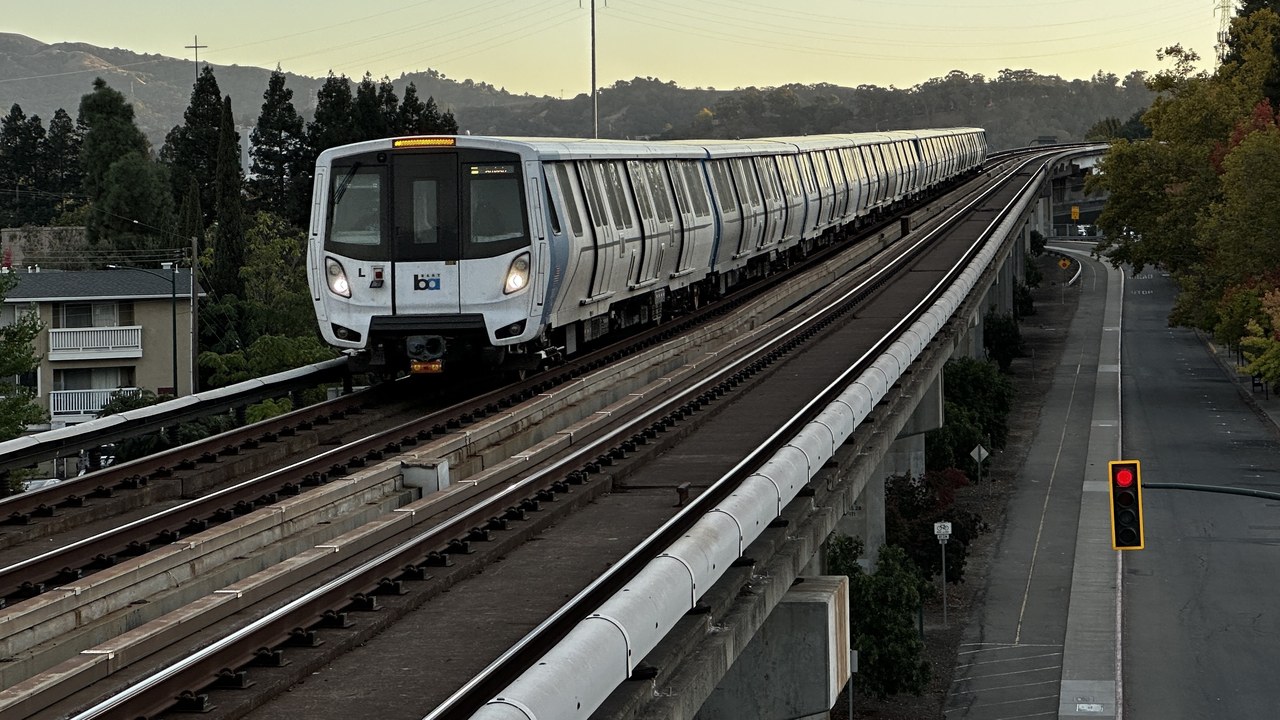
In the 1960s, voters approved a $792 million bond issue to finance a 71.5-mile high-speed transit system of 33 stations serving 17 communities in three counties, according to BART’s history page.
The numbers describe the system as voters were asked to fund it, so they reflect the original plan and not today’s network. The bond works out to roughly $11 million per mile of planned line, and the 33 stations across 17 communities average just under two stations per community.
5. MBTA subway: Oldest in North America
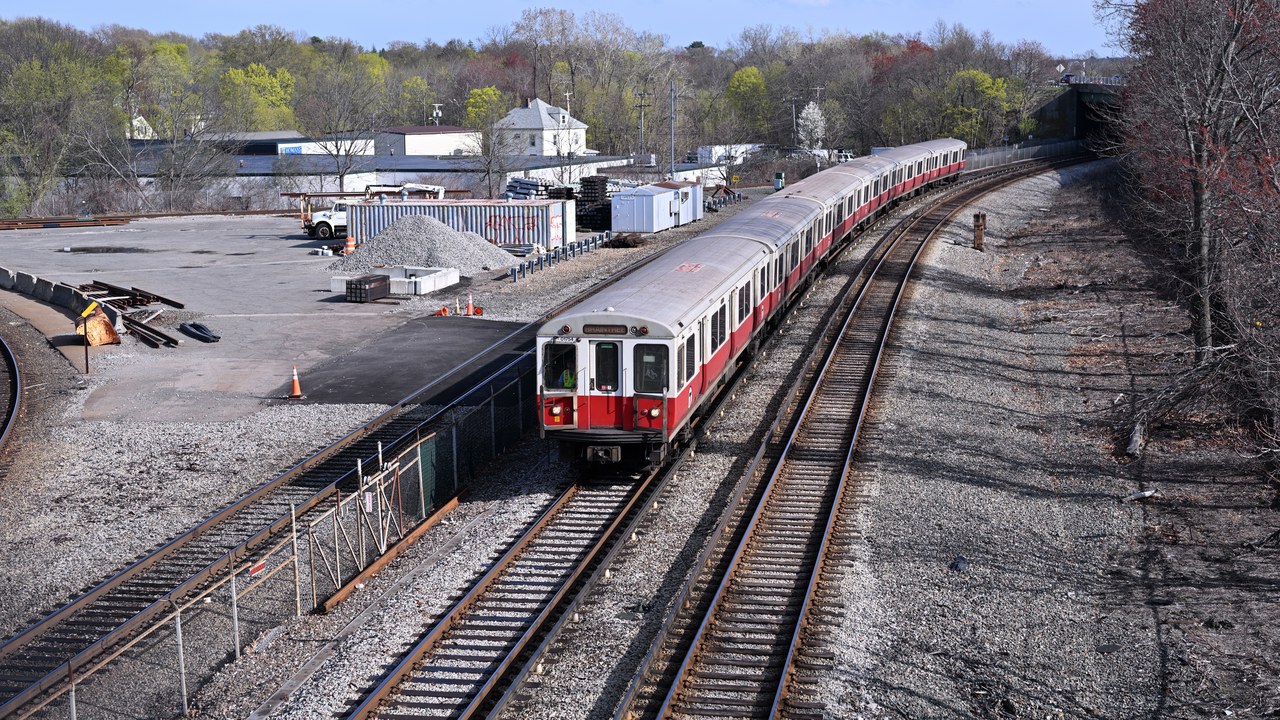
The section of the Tremont Street subway between Park Street and Boylston Street stations, now on the Green Line, opened in 1897. That date makes it the oldest transit subway in North America still in use, preceded only by a short-lived pneumatic line, per Wikipedia.
The distinction belongs to one short section and not the whole network. A rider on that stretch of the Green Line is travelling through infrastructure that dates to the nineteenth century.
6. SEPTA Broad Street Line: Second-Busiest Route
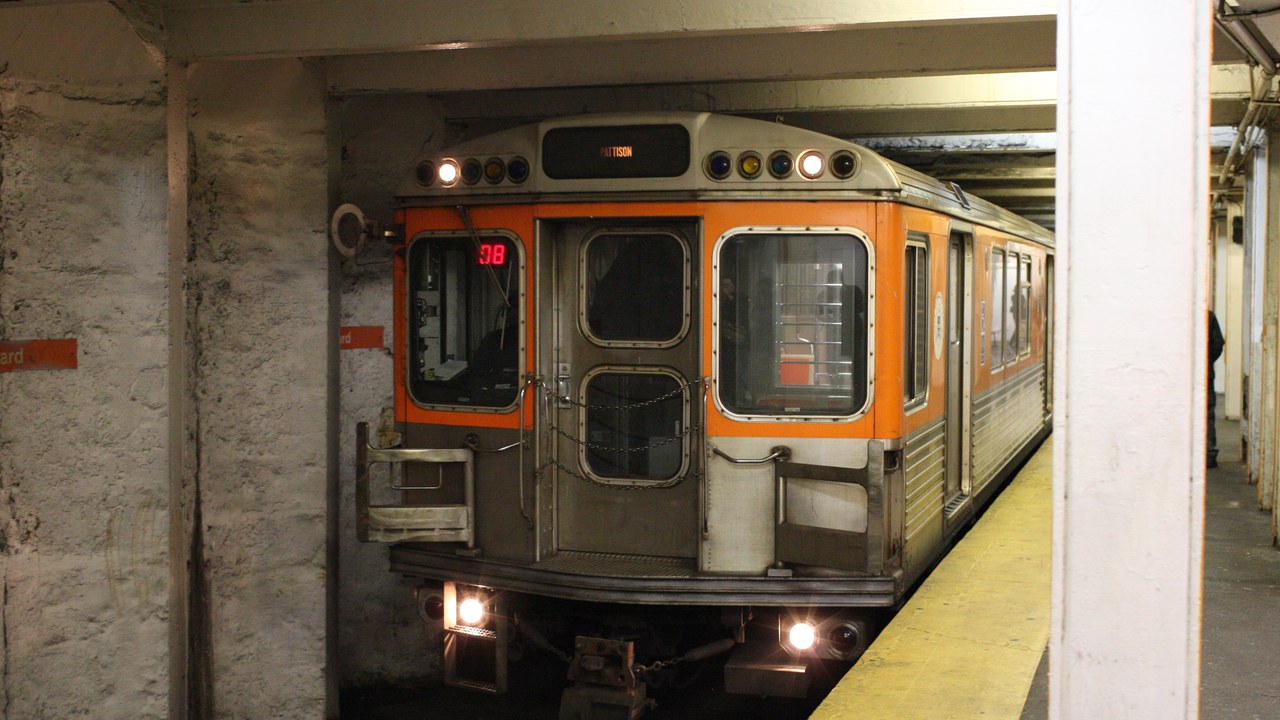
With about 115,000 boardings on an average weekday in 2019, the Broad Street Line is the second-busiest route in the SEPTA system, according to Wikipedia.
The figure is a 2019 measure, so it predates the later years covered by other systems on this list. It ranks the line within SEPTA only, and says nothing about how the line compares with subways in other cities. Because the ranking is among SEPTA routes, the busiest route in that agency’s system still carries more weekday boardings than this line does.
7. Metropolitan Atlanta Rapid Transit Authority: Eighth by Ridership
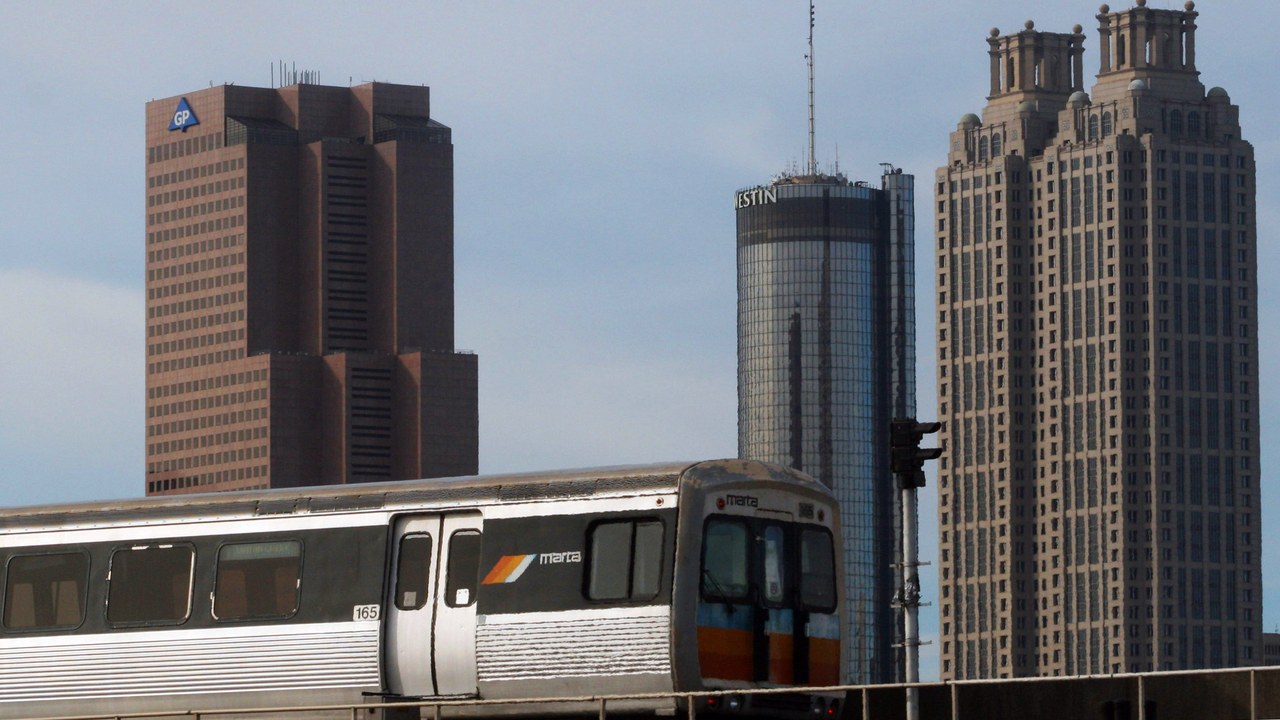
MARTA has 48 miles of rail track and 38 subway stations, and Wikipedia calls its system the eighth-largest rapid transit system in the United States by ridership.
The ranking is by ridership and not by track length, so the mileage and station counts describe the network’s footprint while the rank describes its use. The rank is a comparison among American rapid transit systems, which places the Atlanta network behind seven others on that measure. Its 38 stations are more than double the 14 on Baltimore’s line.
8. Metrorail (Miami-Dade County): Airport to Downtown
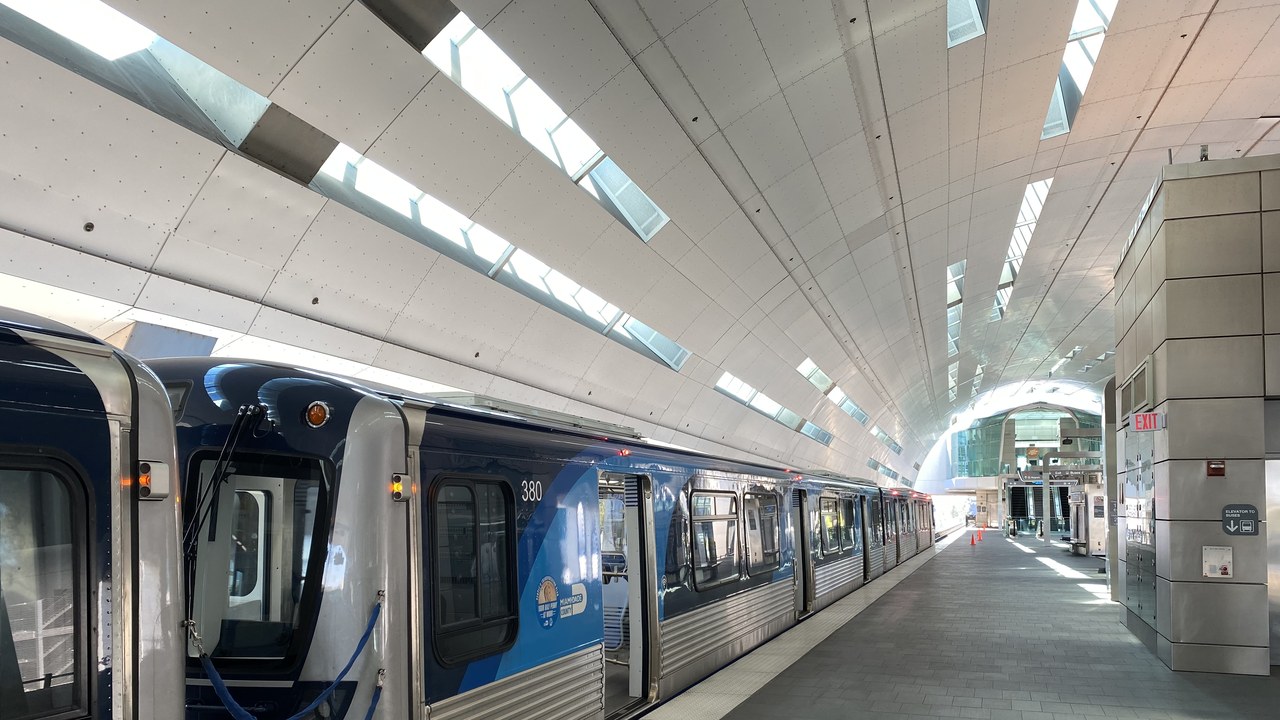
The Metrorail system is a 25-mile dual track that serves Miami International Airport and runs from Kendall through South Miami, Coral Gables and downtown Miami. It continues to the Civic Center and Jackson Memorial Hospital area, according to Miami-Dade County.
The airport connection is the feature the county names first, and the route links several distinct districts along one line. At 25 miles, the line is well under BART’s original 71.5-mile plan, so it covers a smaller footprint.
9. PATCO Speedline: Born of a Bridge
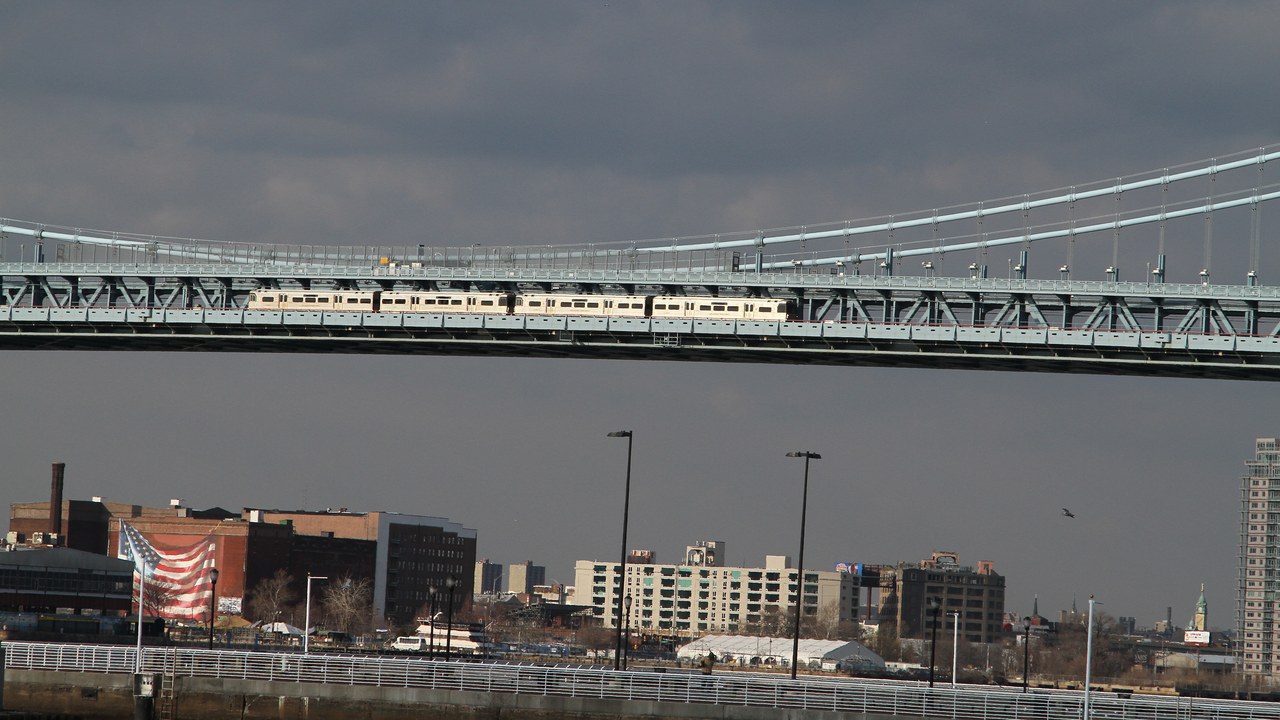
The history of the PATCO Speedline began in 1926 with the creation of the Delaware River Bridge Commission and construction of the Delaware River Bridge, now called the Benjamin Franklin Bridge. The bridge line itself opened on June 7, 1936.
The line therefore grew out of a bridge project, with a decade between the commission’s creation and the opening. Riders on the Speedline today use a route whose origins are tied to the Delaware River Bridge.
10. Baltimore Metro SubwayLink: Deep Underground
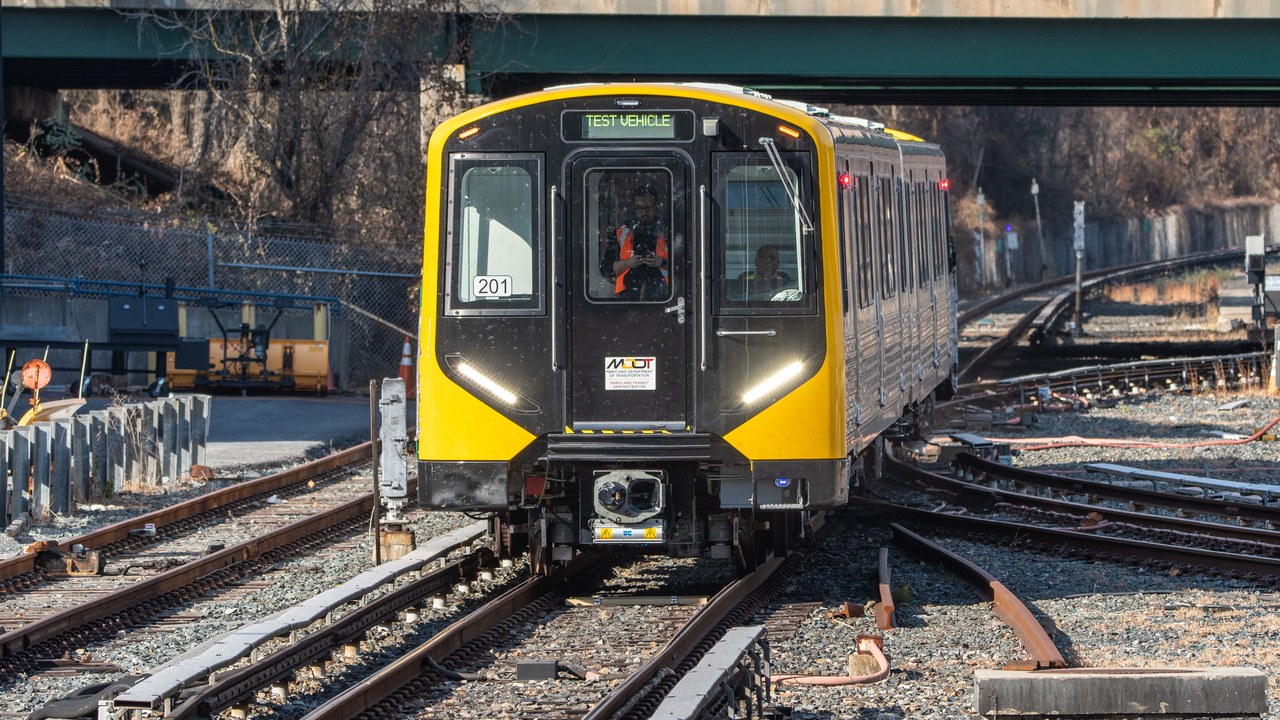
Baltimore Metro SubwayLink had 4,610,400 rides in 2025, or about 15,000 per weekday as of the second quarter of 2026. Eight of its 14 stations are buried between 52 and 112 feet below the street.
Burying more than half of the stations at those depths marks a good share of the system as deep underground. The ridership numbers, by contrast, are well below the New York and Washington totals elsewhere on the list. Baltimore’s 4,610,400 annual rides also fall just under Staten Island Railway’s 5,437,400.
11. Staten Island Railway: Rides on the Island
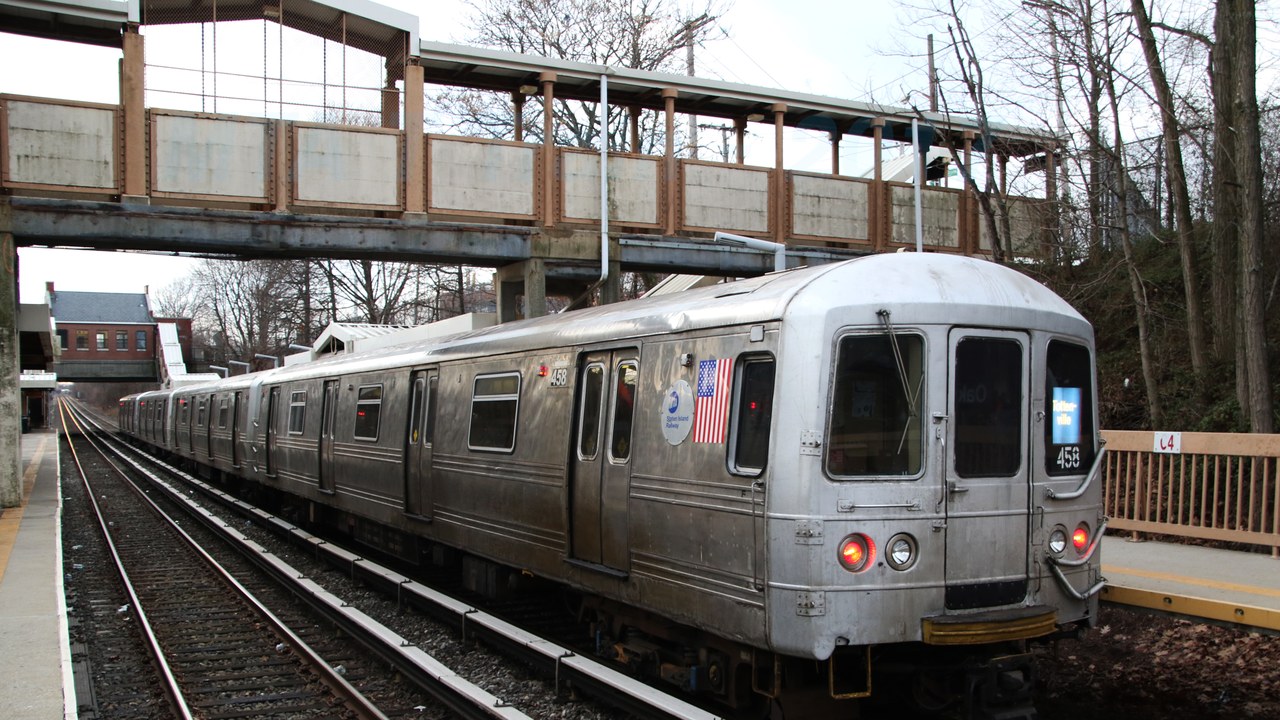
Staten Island Railway had ridership of 5,437,400 in 2025, about 21,000 on an average weekday as of the second quarter of 2026.
It carries a larger annual total than Baltimore’s system, though both are small beside the totals for New York and Washington. The weekday number is a snapshot from the second quarter of 2026 and not an annual average. The figure sits at a small fraction of the subway’s 1.2 billion annual trips, which makes it a useful contrast within the same city. At about 21,000 on an average weekday, it carries more than Baltimore’s roughly 15,000.
More from Morning Overview
- Four U.S. startups fired up their first small nuclear reactors, aiming to power AI data centers on-site
- Card skimmers hidden on gas pumps and ATMs are draining accounts, and here’s the tell
- Doctors warn a silent liver disease now affects one in three American adults
- Hackers are hijacking outdated home routers, and the FBI named the models to check
