
The Federal Aviation Administration counts every passenger who boards a flight, and its 2025 tallies show a few big airports shrinking while others grew. Atlanta stayed on top with more than 51 million boardings despite a small decline. Here are eleven of the nation’s busiest airports, with the numbers behind each ranking.
1. Atlanta Hartsfield-Jackson: Still The Top Gate

Atlanta’s field opened 2025 as the national leader, though its lead came with a dip. FAA tallies put it at enplanement count of 51,459,786, a 2.00% drop from 2024. That is a drop of roughly a million boardings from the prior year’s level, enough to notice but nowhere near enough to threaten the ranking.
Even after the slide, the gap to the next airport remained wide. Atlanta’s position rests on its role as a connecting hub, where a large share of passengers change planes rather than begin or end a trip, which keeps volume high through softer travel demand.
2. Chicago O’Hare: Growth In The Midwest
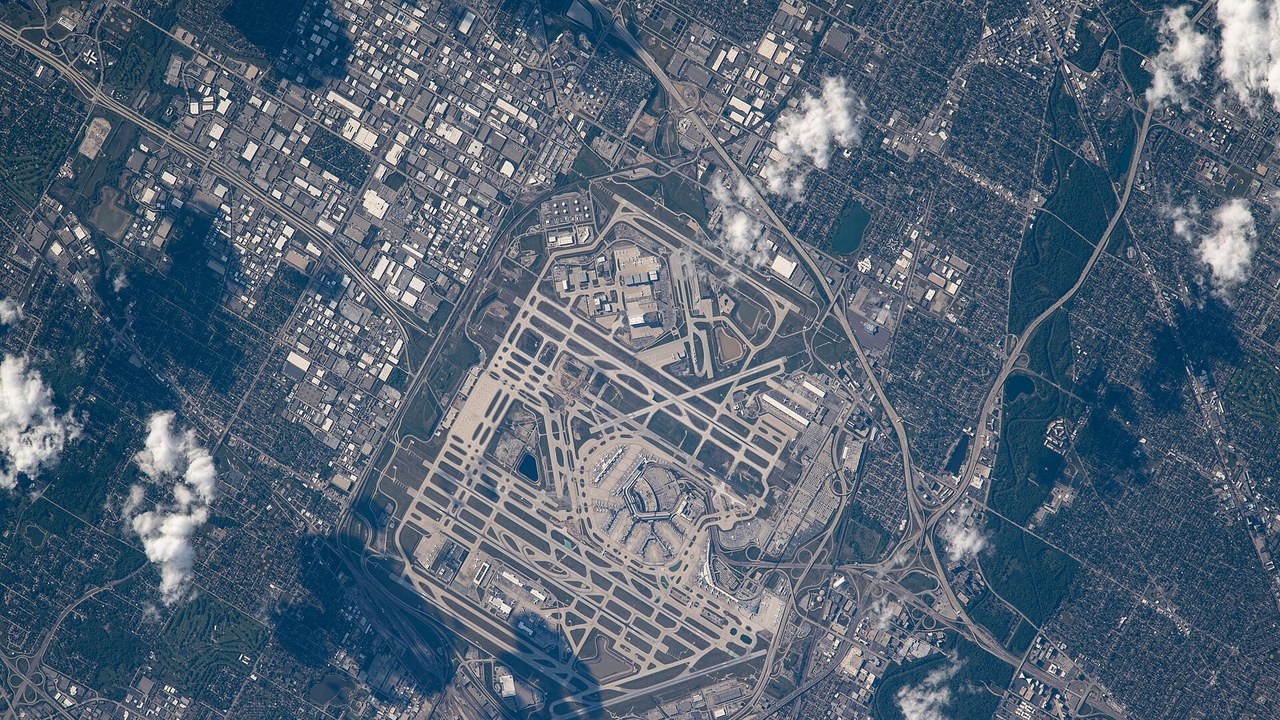
Chicago’s biggest airport ran against the grain of the leaders. The agency recorded 40,680,735 enplanements in 2025, an increase of 5.46% over 2024. Climbing while neighbors at the top fell makes the number stand out in this year’s tables.
The third-place finish sits well behind Atlanta yet comfortably ahead of Los Angeles at fifth. O’Hare’s gain suggests that demand in the nation’s central hub system held up better than in some coastal markets.
3. Denver International: Fourth On The List
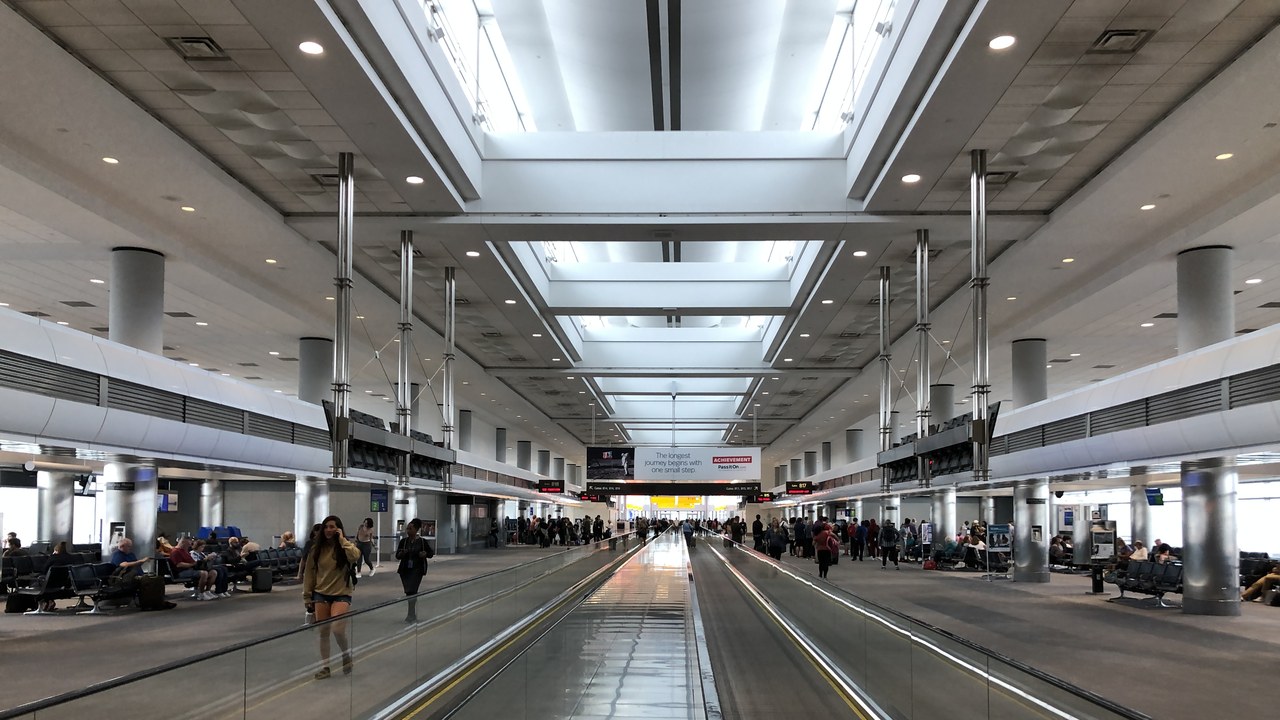
Denver’s airport slotted into fourth place nationally. According to the FAA’s final CY2025 table, it handled 39,976,695 boardings in 2025, which puts it just shy of the 40 million mark.
The entry carries no year-over-year change in the research notes, so the ranking is the whole story here. Denver sits only about 700,000 boardings behind Chicago, a margin of about 700,000 that could flip the order in a later year if either airport’s traffic shifts.
4. Los Angeles International (LAX): A Rare Backslide
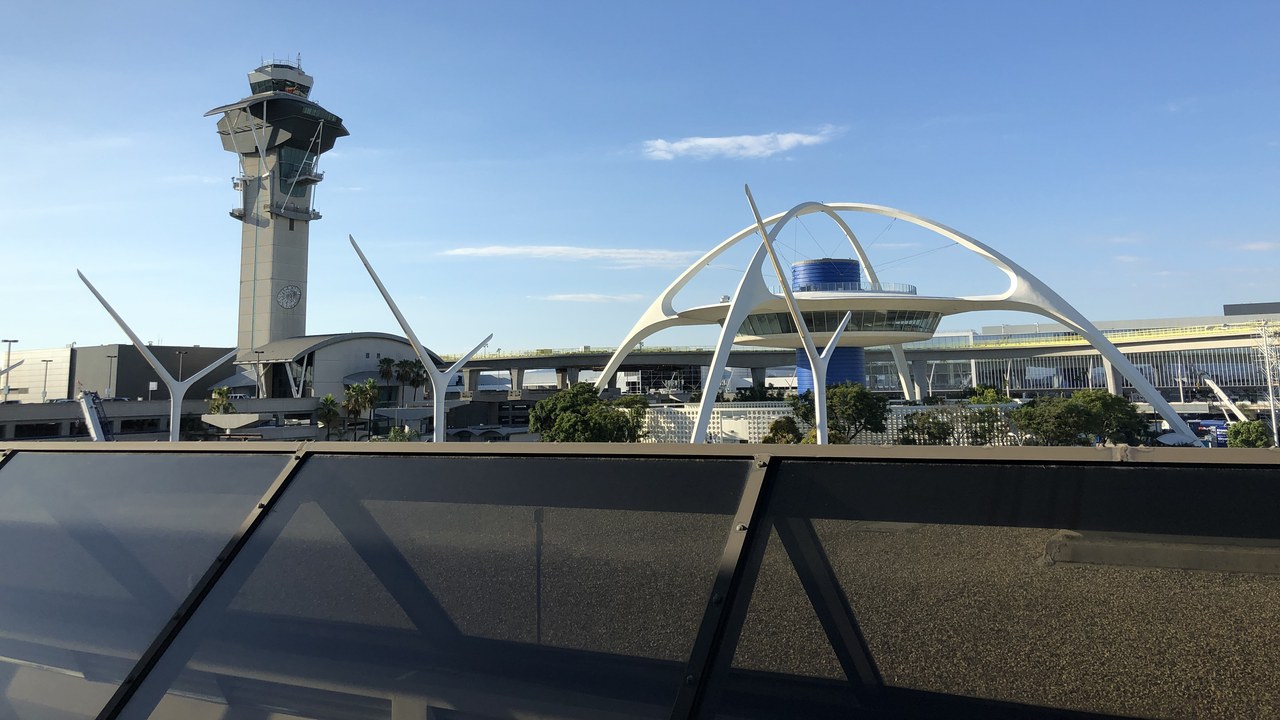
The Los Angeles gateway took the steepest tumble among the large hubs in this set. The FAA’s final enplanement list credits it with 36,497,303 enplanements, down 3.35% from the year before, which still earns fifth place nationally.
A decline of that size at a top-five airport is notable because it is far larger than the dip at Atlanta. The figure leaves LAX comfortably inside the elite tier, but moving in the wrong direction while Chicago and San Francisco added passengers.
5. Orlando International: Florida’s Volume Leader
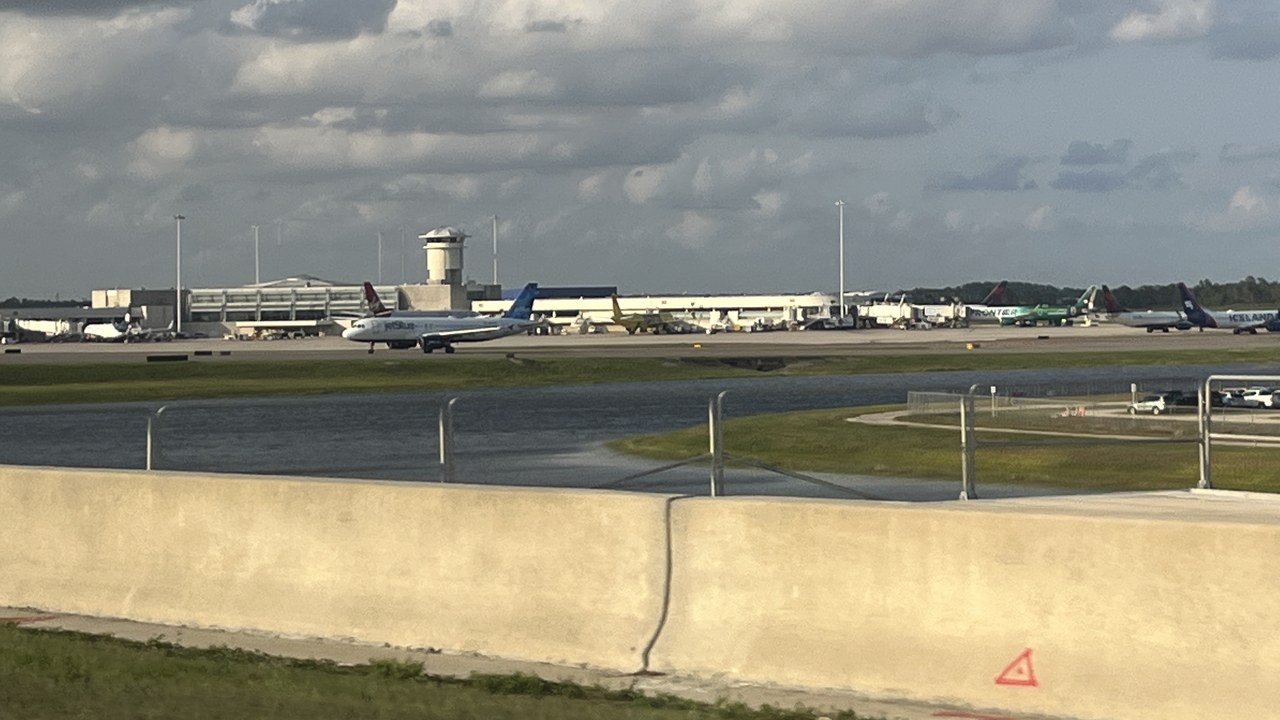
Orlando ranked seventh in the nation by boardings. The agency’s preliminary CY2025 release lists 27,999,709 enplanements for 2025, just under the 28 million line.
The listing is marked preliminary, so the last digits could still be adjusted when the agency finalizes its books. As a leisure-heavy market, Orlando posts numbers that put it ahead of every other Florida airport in this ranking, including Miami, which follows two places lower. Tourism demand, rather than connecting traffic, is the usual explanation for a ranking like this, though the FAA tables themselves do not break the numbers down by trip purpose.
6. Miami International: Ninth Among Giants
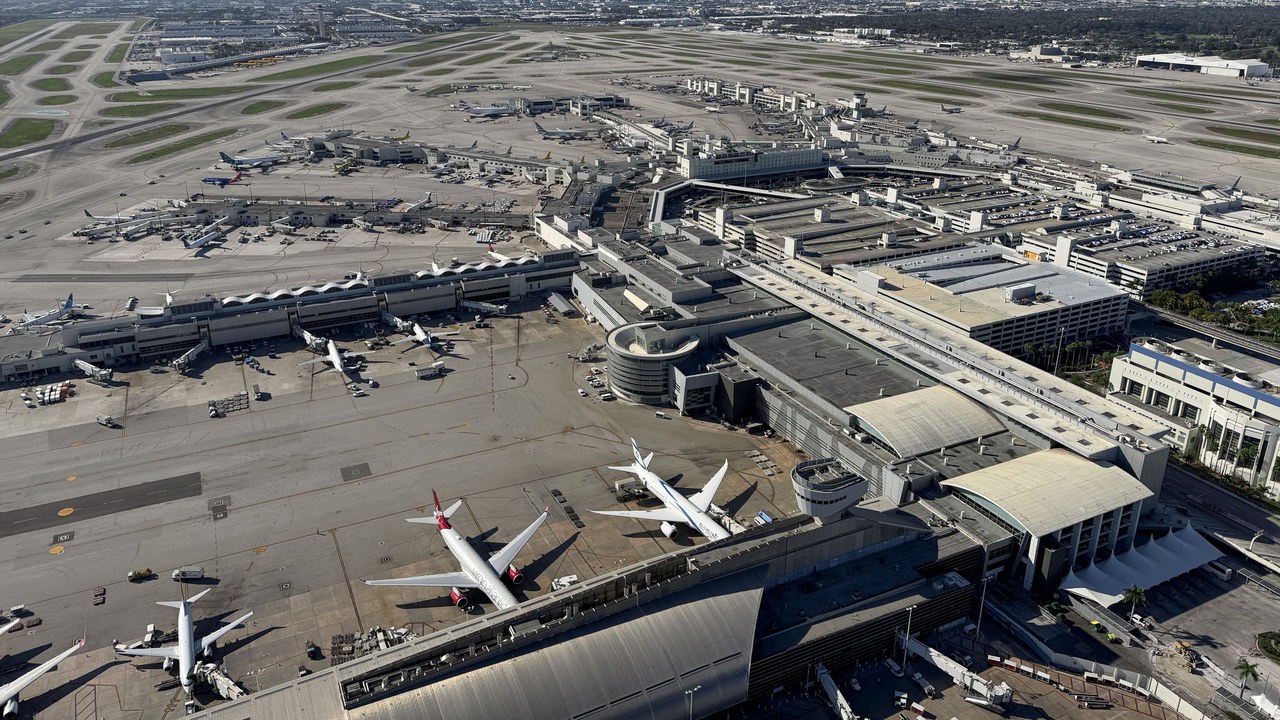
Miami landed at ninth in the FAA ranking. The preliminary CY2025 figures shows 26,450,972 enplanements, a total that trails Orlando by about 1.5 million boardings across the year.
As with other entries drawn from the preliminary file, the count is subject to later revision. The placement is notable because Miami is the second Florida airport in this set and still finishes well inside the nation’s top ten. It also sits barely 200,000 boardings ahead of San Francisco, so a small swing in either direction could trade the two places in a later release.
7. San Francisco International: Back On The Rise
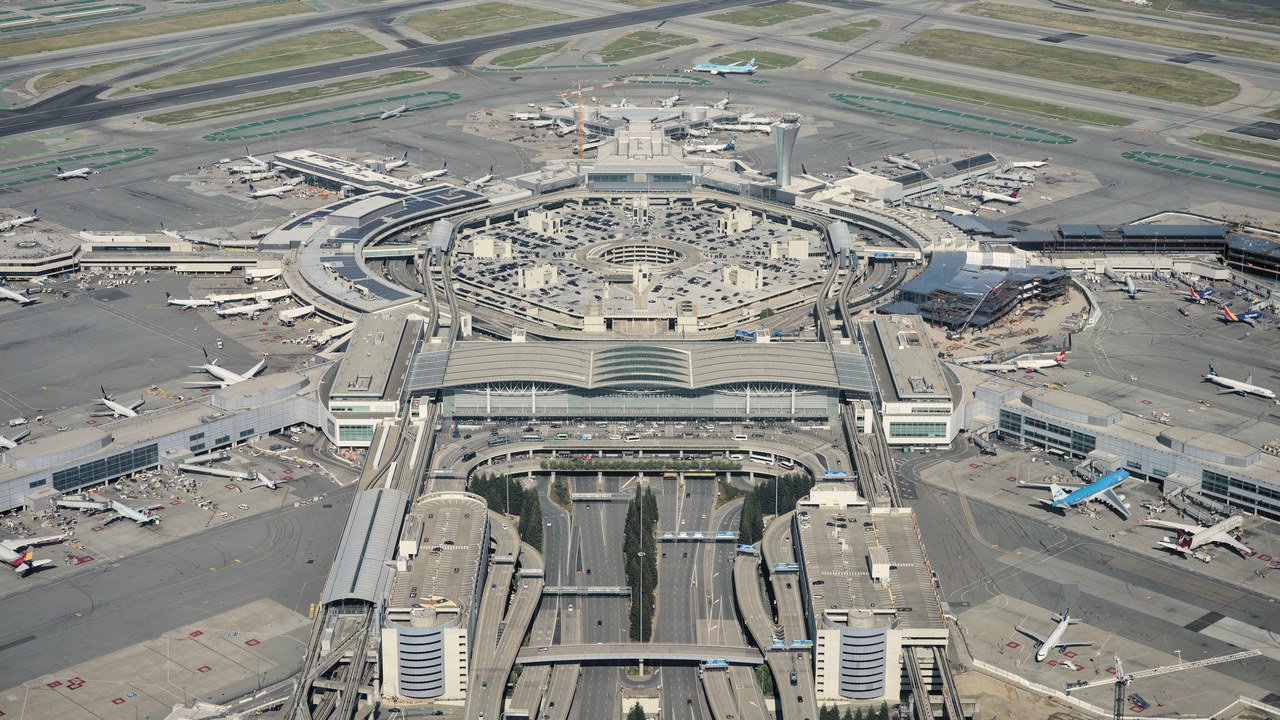
San Francisco returned to growth, posting a gain of 4.68%. The preliminary FAA data gives the field 26,251,850 enplanements in 2025, enough for tenth place nationally.
A rise near five percent stands in contrast to the declines recorded at Atlanta, Los Angeles and Minneapolis. The count remains preliminary, but the direction of travel appears clear, and tenth place puts the Bay Area gateway just behind Miami in the ranking. A single-year jump of that size is among the strongest in this group, though one preliminary year does not establish a lasting trend.
8. Phoenix Sky Harbor: Desert Hub Climbs In
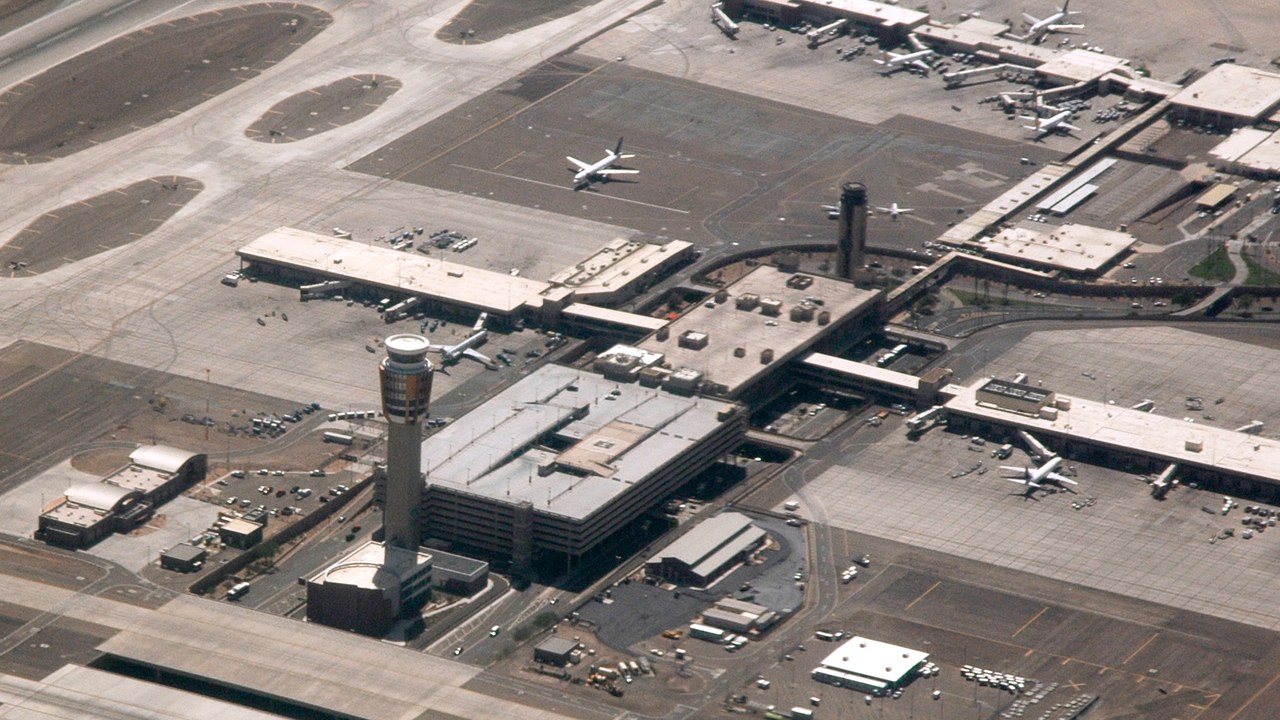
Phoenix’s main airport ranks thirteenth, a position just outside the top ten. The preliminary CY2025 table lists 25,094,817 enplanements, past the 25 million mark.
The numbering gap between tenth place and thirteenth is only about 1.2 million boardings, so small shifts could reorder the middle of the pack. Phoenix’s rank also shows how a sunbelt hub can compete with older coastal gateways on raw volume. Sky Harbor also finished roughly 3.9 million boardings ahead of Boston, which gives it a comfortable cushion over the airports ranked just below it.
9. Boston Logan: Sixteenth And Counting
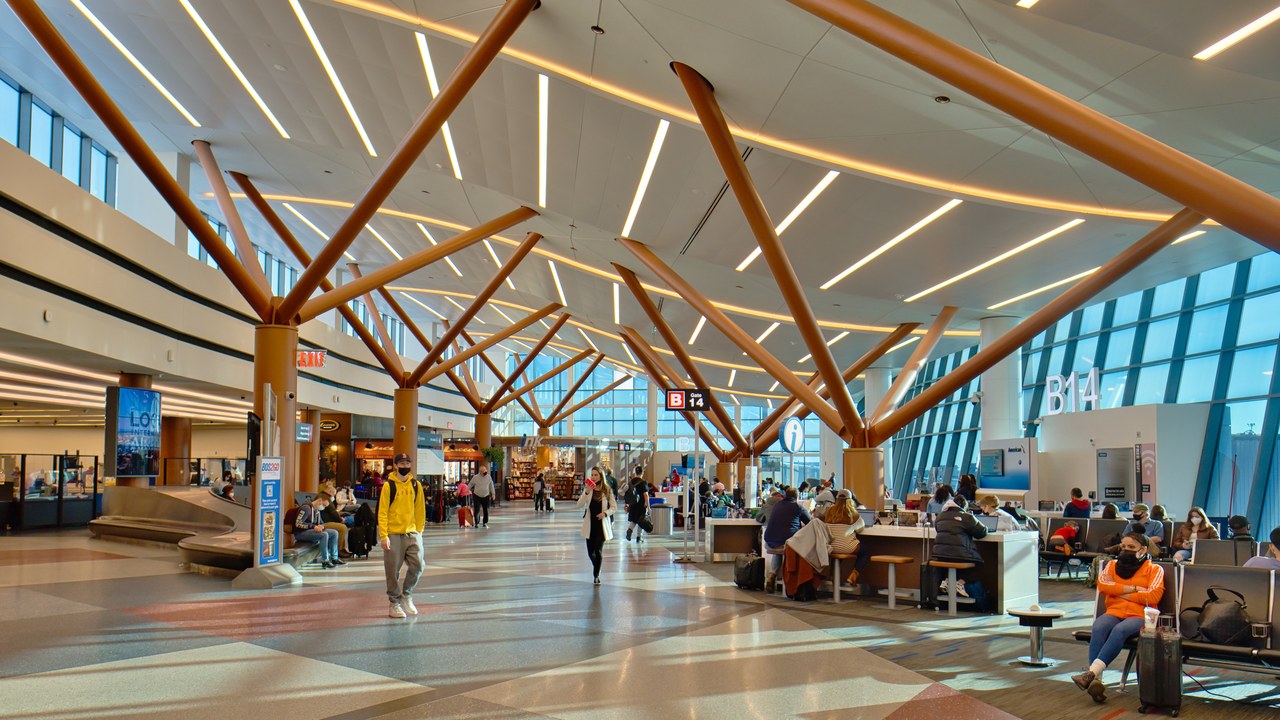
Boston’s airport reached sixteenth nationally. The FAA all-enplanements report counts 21,021,153 enplanements for 2025, more than twenty-one million boardings.
The ranking sits several steps below the preliminary-data leaders, and the gap to Phoenix is roughly four million passengers. For a single-city gateway on a small peninsula, a total above twenty million is substantial and places it ahead of both Minneapolis and Detroit. The number also counts only boarding passengers, so total traffic through the terminals, which includes arrivals, is considerably higher than the headline figure suggests.
10. Minneapolis-St. Paul International: A Midwest Dip

Minneapolis-St. Paul placed seventeenth and shrank in the process. According to the FAA full enplanement list, it posted 17,488,261 enplanements in 2025, down 3.14% from 2024.
A decline of just over three percent is comparable to the slide at Los Angeles but happened at a far smaller field. Boston finished a position higher, with roughly 3.5 million more boardings than the Minnesota hub, so the decline did nothing to narrow that distance.
11. Detroit Metro: Closing Out The Group
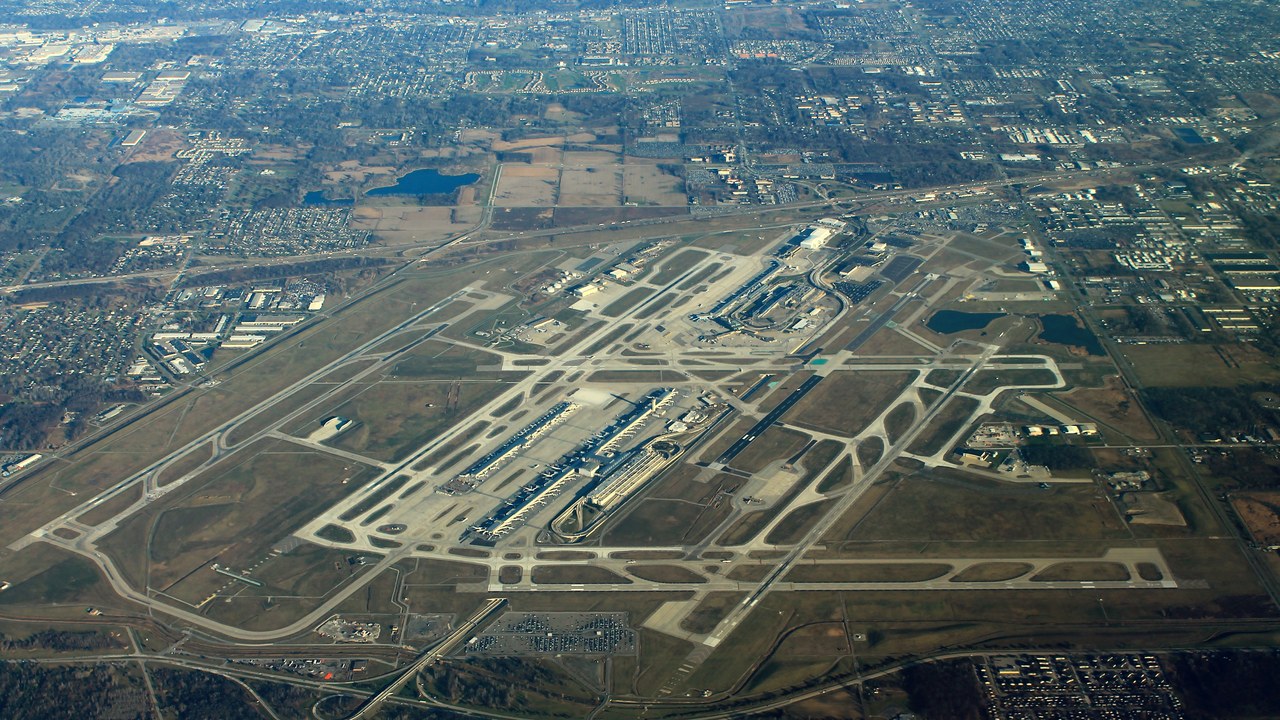
Detroit rounds out this set at eighteenth. The FAA all-enplanements document credits the airport with 16,294,768 enplanements in 2025, a total that sits roughly 1.2 million boardings behind Minneapolis.
The research notes give no year-over-year change for Detroit, so the standing alone defines its entry. Even at eighteenth place, the Michigan hub moves more than sixteen million boarding passengers annually, a volume that dwarfs most regional airports across the country. The Michigan hub also holds a lead of roughly 650,000 boardings over the next airport on the reserve list, Fort Lauderdale-Hollywood, which sits twentieth.
More from Morning Overview
- Ford is recalling 223,472 F-150 pickups because the fuel tank can leak or detach
- Hybrids have 15% fewer problems than gas cars, while EVs and plug-in hybrids have about 80% more, Consumer Reports finds
- Regulators cleared the first U.S. small modular reactor, 4 months early
- Lake Powell sank to a record 3,517 feet, nearing the level that stops Glen Canyon Dam’s turbines
