
Insurance payouts reveal which vehicles cost the most to repair and which drivers file the most injury claims. Sports coupes and performance sedans top the collision table, while inexpensive small cars lead the injury list. The twelve models below show both extremes, ranked by the published loss figures.
Tech news in one quick read: Get the most interesting stories in startups, tech and programming, each with a short TLDR, in one daily email from TLDR.
We may earn a commission if you sign up.
1. BMW M4: Rarely Cheap to Fix
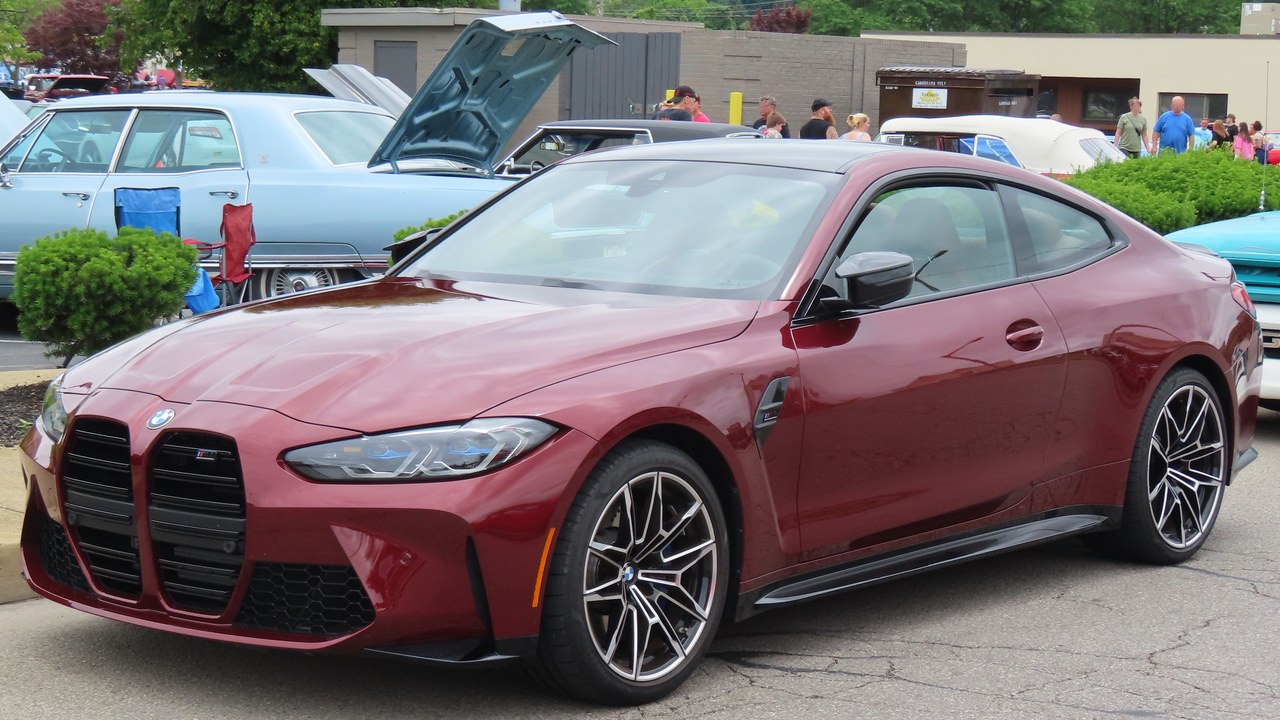
Highway Loss Data Institute figures put the BMW M4 collision losses at the very top of the collision table. Against an all-vehicle average set at 100, the M4 scored 741, which works out to more than seven times the norm for relative collision losses.
That is the number behind this gallery’s ordering. Insurers measure losses per insured vehicle year, so the score reflects what each crash costs to settle across the whole fleet of insured M4 coupes, not any single repair.
2. BMW M5: Wagon-Sized Bills
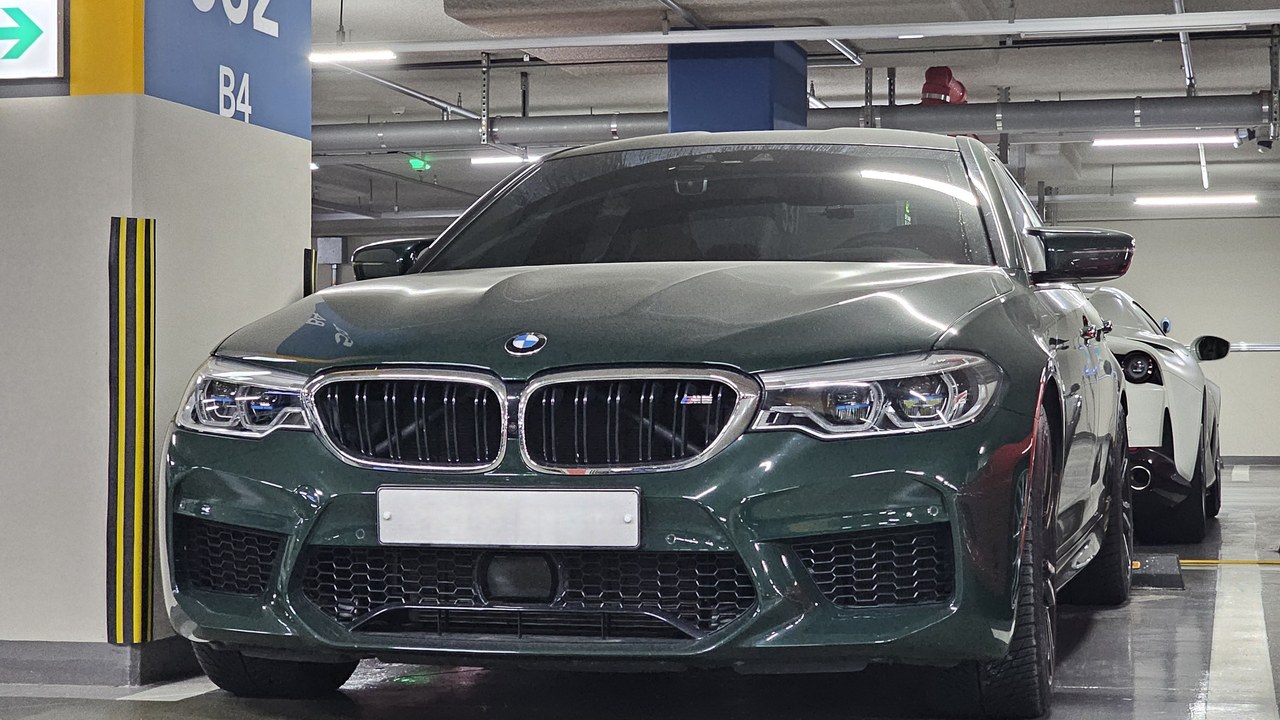
On the same HLDI scale, where 100 represents the average vehicle, the BMW M5 score of 506 lands at 506. That is a little over five times the typical level of relative collision losses.
The score measures payouts to policyholders rather than driver behavior. A high-output performance car can cost insurers several times the average even when it is a practical, full-size four-door model rather than a pure sports coupe.
3. Dodge Charger SRT Hellcat: Muscle Car Math
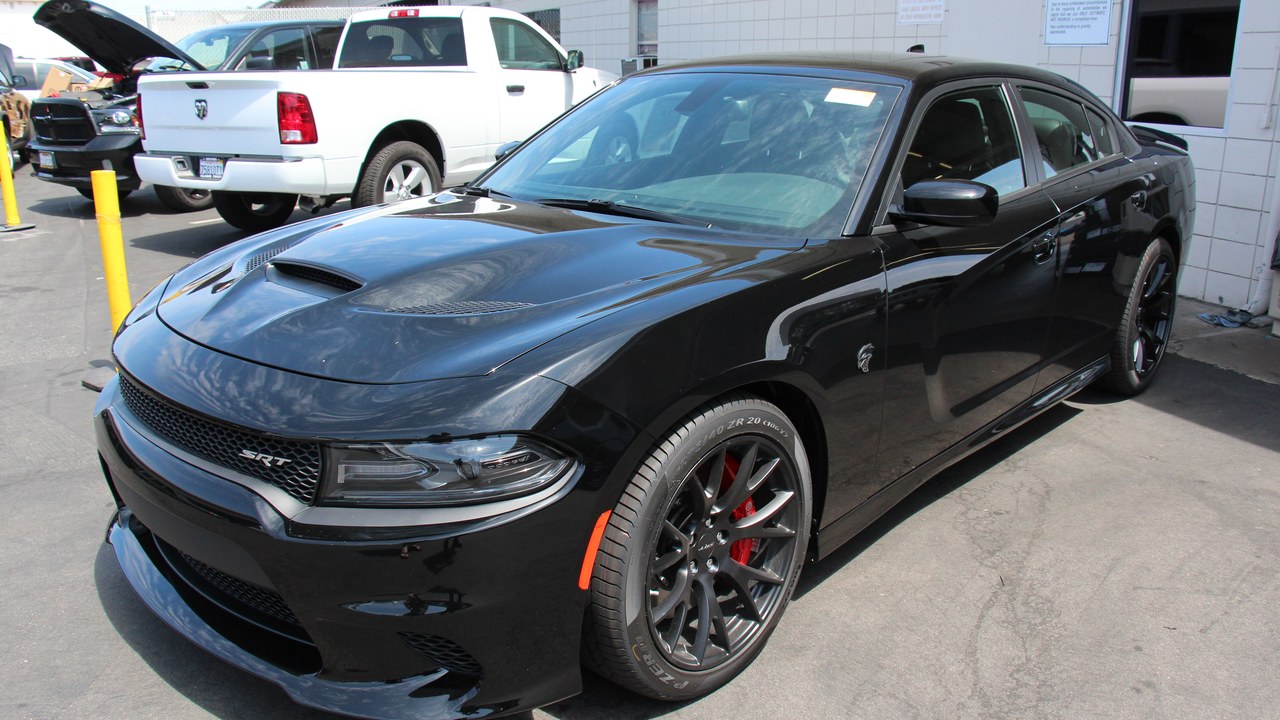
The HLDI collision results give the Dodge Charger SRT Hellcat losses a relative loss figure of 506, matching the BMW M5 exactly. With 100 marking the average, that means insurers pay out roughly five times as much on collision claims.
A supercharged American sedan sits level with a German performance benchmark in this ranking. The table records what insurers actually paid, and in that ledger the Hellcat is as expensive as the European competition.
4. Porsche 911 Turbo: Turbo Money
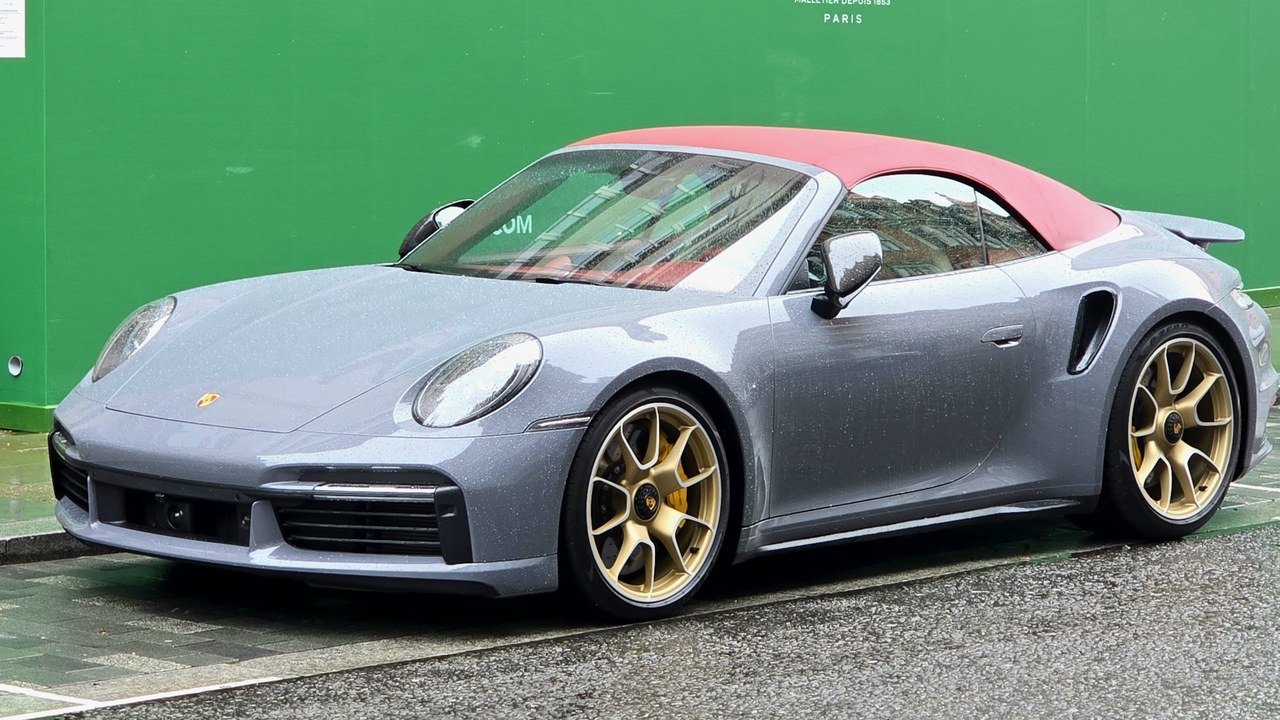
Insurance data from HLDI assigns the Porsche 911 Turbo collision losses a relative collision loss score of 432, using 100 as the average for all vehicles. That is more than four times what a typical model costs insurers in collision claims.
The figure shows how a premium sports car, can rank among the costliest to insure. The Turbo trails the M4 and M5 but still sits far above the baseline.
5. Ford Mustang: Pony Car, Pricey Claims
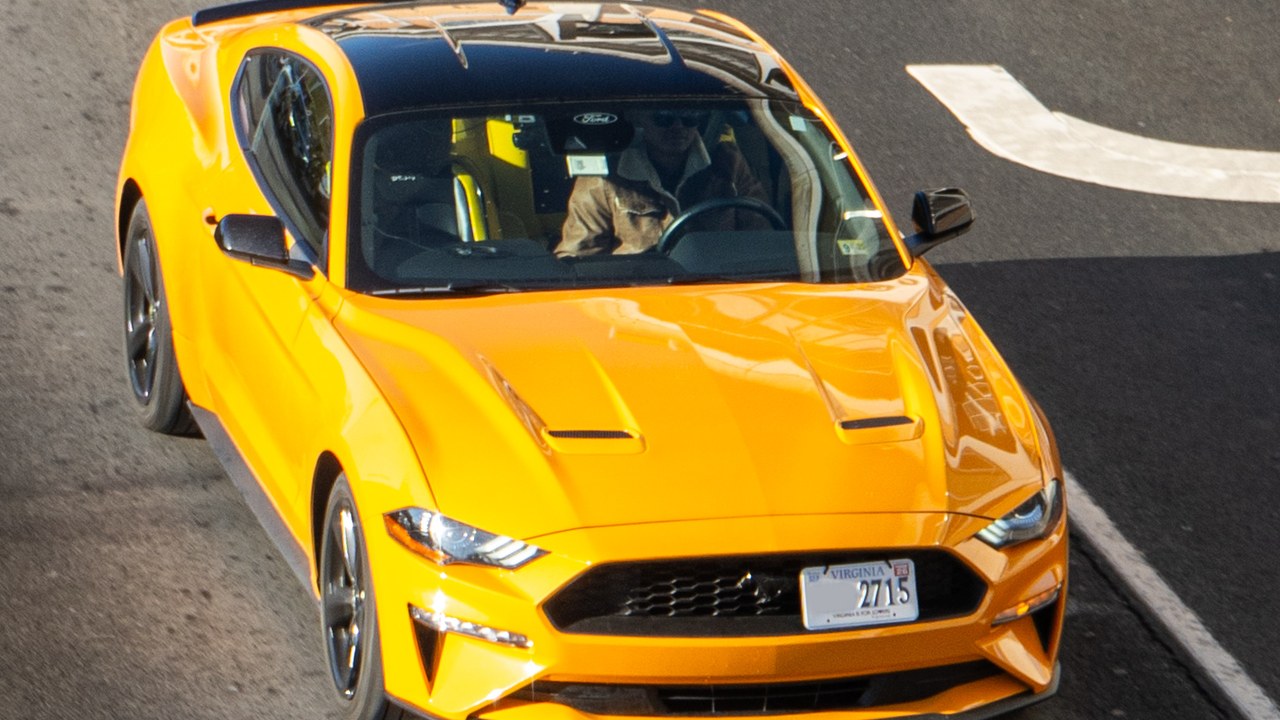
Collision losses on the Ford Mustang collision losses come to $686 per insured vehicle year, according to a Cars.com report on insurance costs. That total comes from 10.3 claims per 100 insured vehicles.
Both numbers matter here. With roughly one claim for every ten insured vehicles, a frequent claim rate and a substantial payout per vehicle combine to put a mainstream sports car in the same discussion as luxury marques, which is the pattern the article highlights.
6. Chevrolet Camaro: Close Behind the Mustang
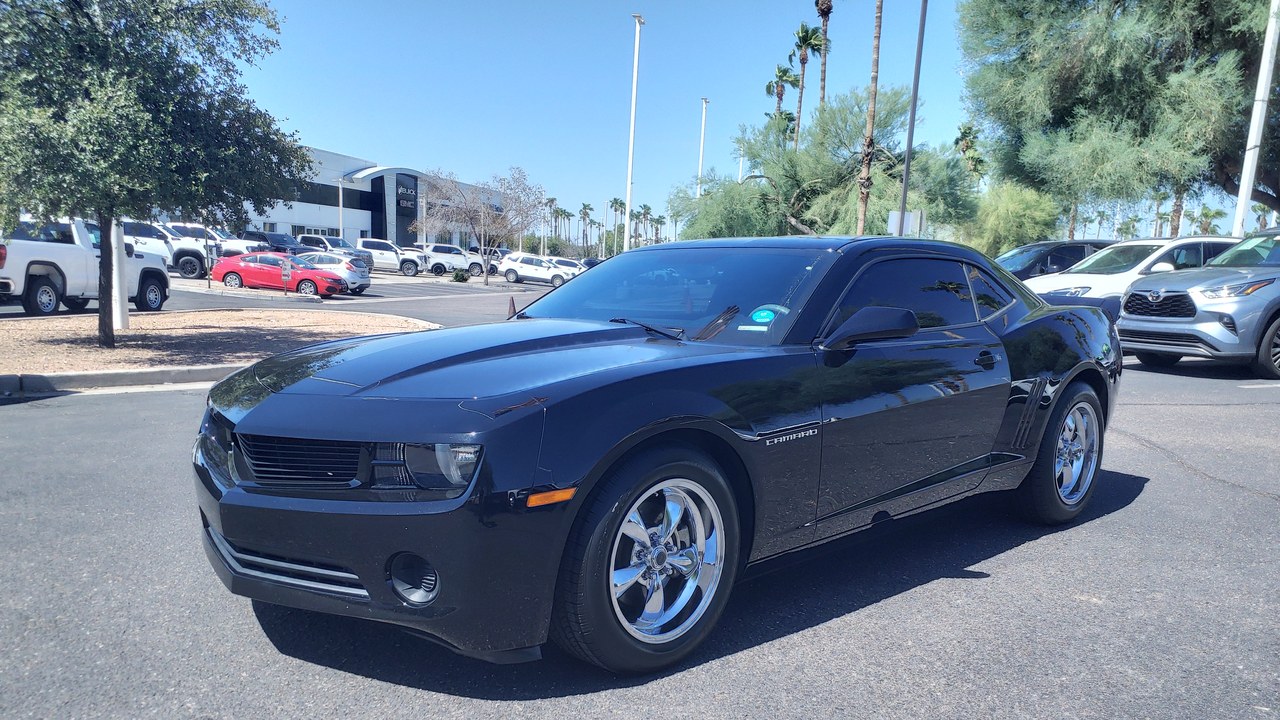
Collision losses for the Chevrolet Camaro loss figures reach $659 per insured vehicle year, on a claim rate of 10.2 per 100 vehicles. That places the Camaro within a few dollars of the Mustang on insurer payouts.
The pairing of similar loss totals and similar claim frequency shows how closely the two long-running rivals track one another. Neither comes out cheap for the companies that cover them, and the claim rate for each is just above ten per hundred vehicles in the same Cars.com report.
7. Dodge Challenger: Retro Looks, Steady Losses
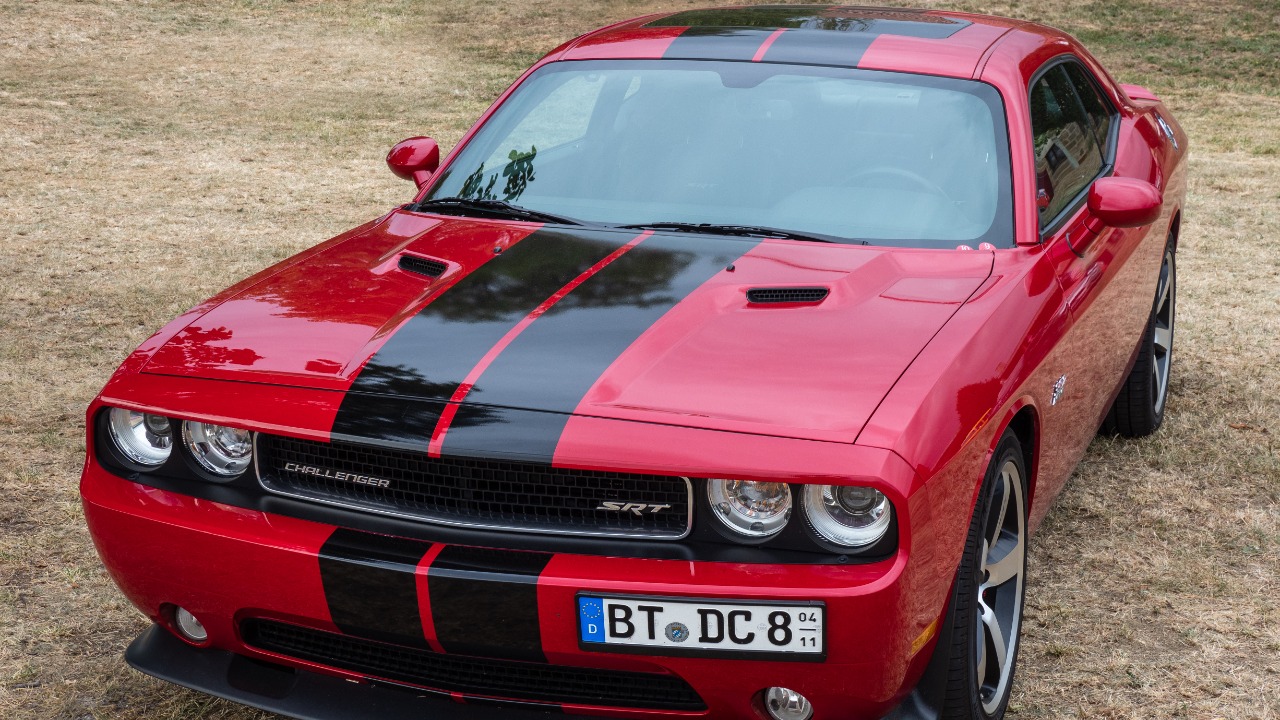
Insurers paid $628 per insured vehicle year in collision losses on the Dodge Challenger payout data, with 10.6 claims per 100 insured vehicles. That claim rate is the highest of the three muscle coupes in this list.
A lower dollar total than the Mustang or Camaro does not signal fewer crashes. Claims arrive at least as often, even if each payout is slightly smaller on average across the insured group.
8. Subaru BRZ: Light Coupe, Heavy Claims
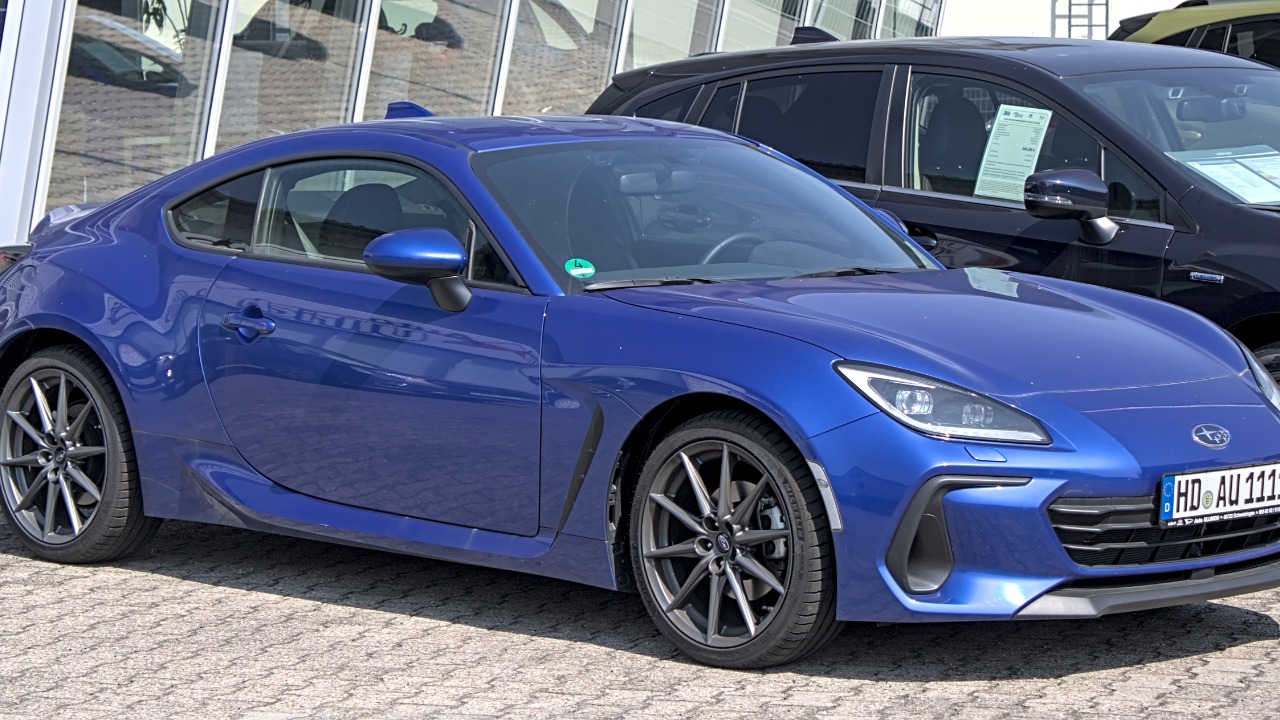
The Subaru BRZ collision losses produced $656 in collision losses per insured vehicle year, on 10.5 claims per 100 vehicles. A compact sports coupe lands right alongside the American muscle cars on both measures.
Heavy payouts do not require a large engine, at least in this report. The BRZ’s loss total sits within a few dollars of the Camaro, showing that sporty body styles can cost insurers a great deal.
9. Mitsubishi Lancer: Injury Claims Leader
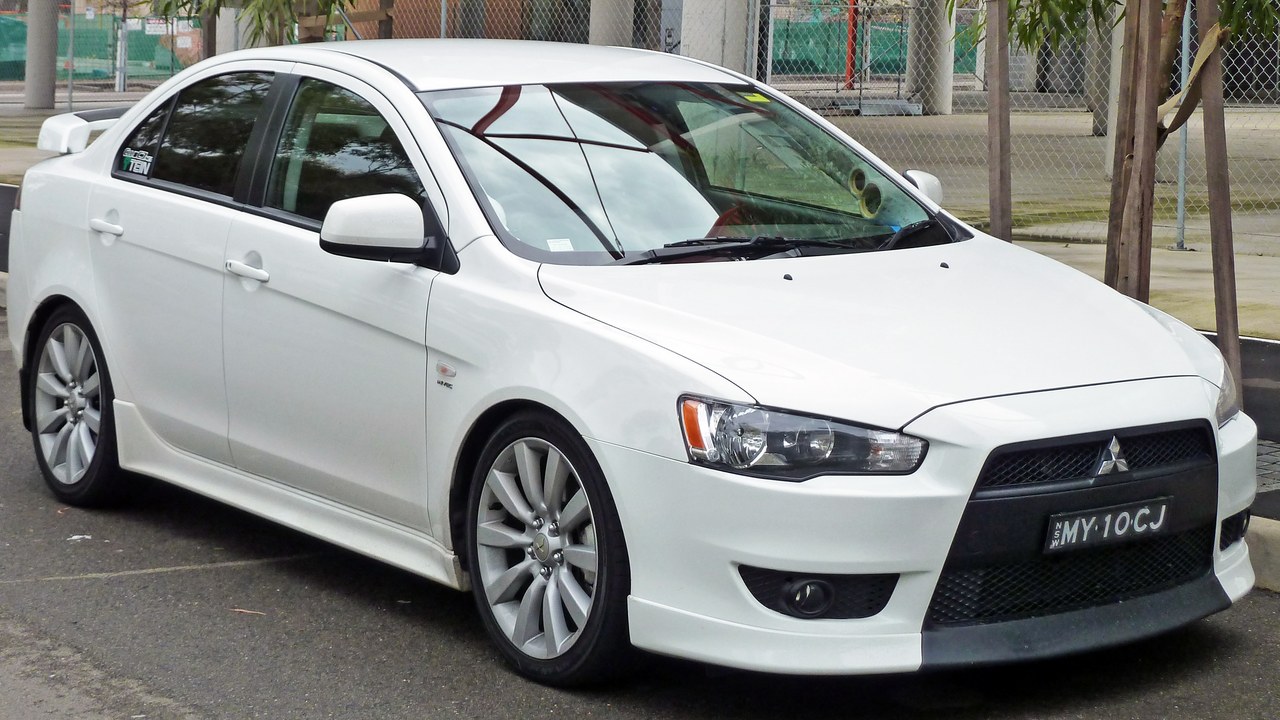
An IIHS Status Report tallied the Mitsubishi Lancer injury claims at 36.0 injury claims per 1,000 insured vehicle years, the highest of any model in the study. The figure covers the two-wheel-drive four-door Lancer in model years 2014 to 2016.
These are personal injury protection claims, not collision repair costs, so the list shifts from performance cars to inexpensive small ones. The number reflects that study period and is not a current-year ranking.
10. Nissan Versa: Small Sedan, High Frequency
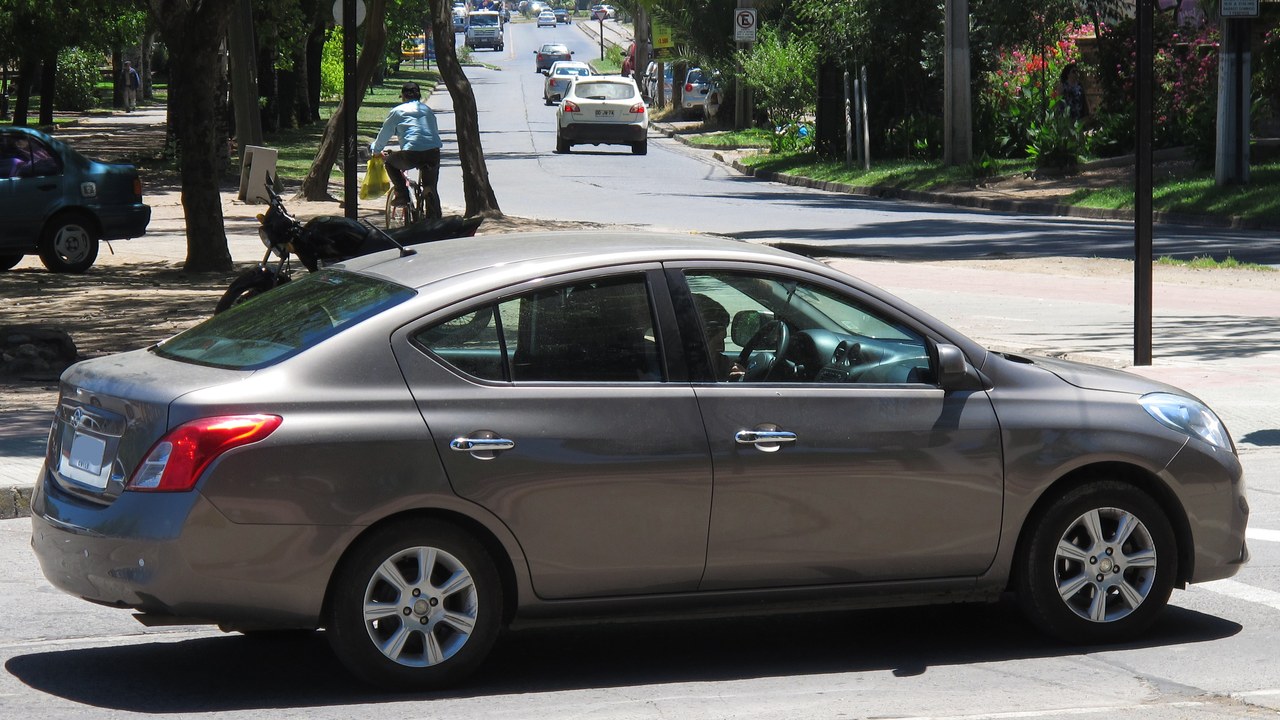
The same IIHS analysis recorded 31.2 injury claims per 1,000 insured vehicle years for the Nissan Versa injury frequency. Only the Mitsubishi Lancer posted a higher rate among the models in the study.
The Versa shows that injury claim frequency has little to do with horsepower, since this model is a compact four-door built to a price. Here the leaders are compact, modestly priced sedans, a very different group from the coupes that top the collision-loss rankings.
11. Kia Rio: Subcompact Showing
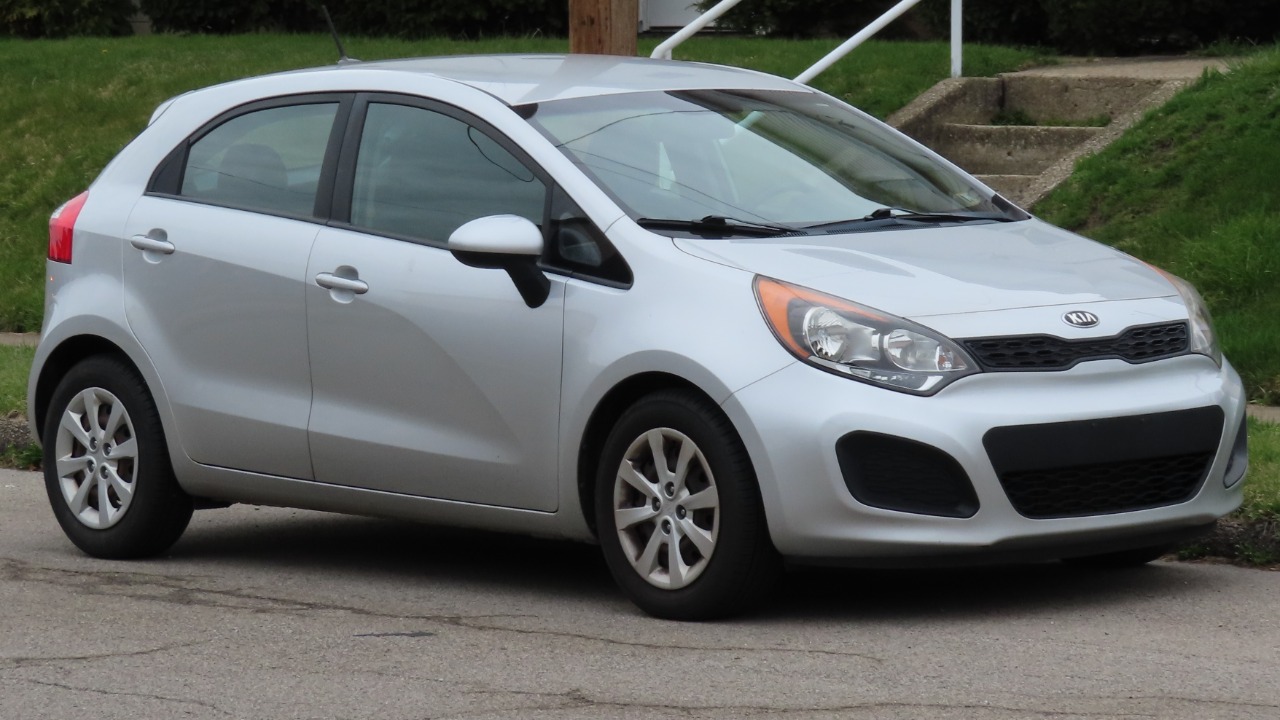
Injury claims on the Kia Rio injury claims reached 30.8 per 1,000 insured vehicle years, according to the IIHS Status Report. That keeps the Rio just behind the Versa and ahead of the final entry on this list.
Another small, low-cost hatchback appears near the top of the injury table. The rate describes how often claims are filed, and the report’s figures on their own do not explain why the pattern emerges.
12. Chevrolet Sonic: Last on the List

The Chevrolet Sonic injury rate closed out the group at 29.8 injury claims per 1,000 insured vehicle years in the IIHS data. That is the lowest rate among the four small cars listed here, though it remains a high figure for the study.
Taken together, these four small cars carry the highest injury claim frequencies in the analysis. Ranking last among them still means a rate far above what most vehicles in the study recorded.
Tech news in one quick read: Subscribe to TLDR →
We may earn a commission if you sign up.
More from Morning Overview
- Hybrids have 15% fewer problems than gas cars, while EVs and plug-in hybrids have about 80% more, Consumer Reports finds
- Regulators cleared the first U.S. small modular reactor, 4 months early
- Lake Powell sank to a record 3,517 feet, nearing the level that stops Glen Canyon Dam’s turbines
- Seven of Earth’s nine planetary boundaries are breached, and all seven are worsening
