
Fatal crash rates per mile driven vary enormously from one model to the next, and a few cars sit far above the national norm. The figures here come from iSeeCars and other reports built on federal crash data. Here are nine vehicles that rank highest, with the biggest multiple of the average at the top.
1. Hyundai Venue: Tops The Table
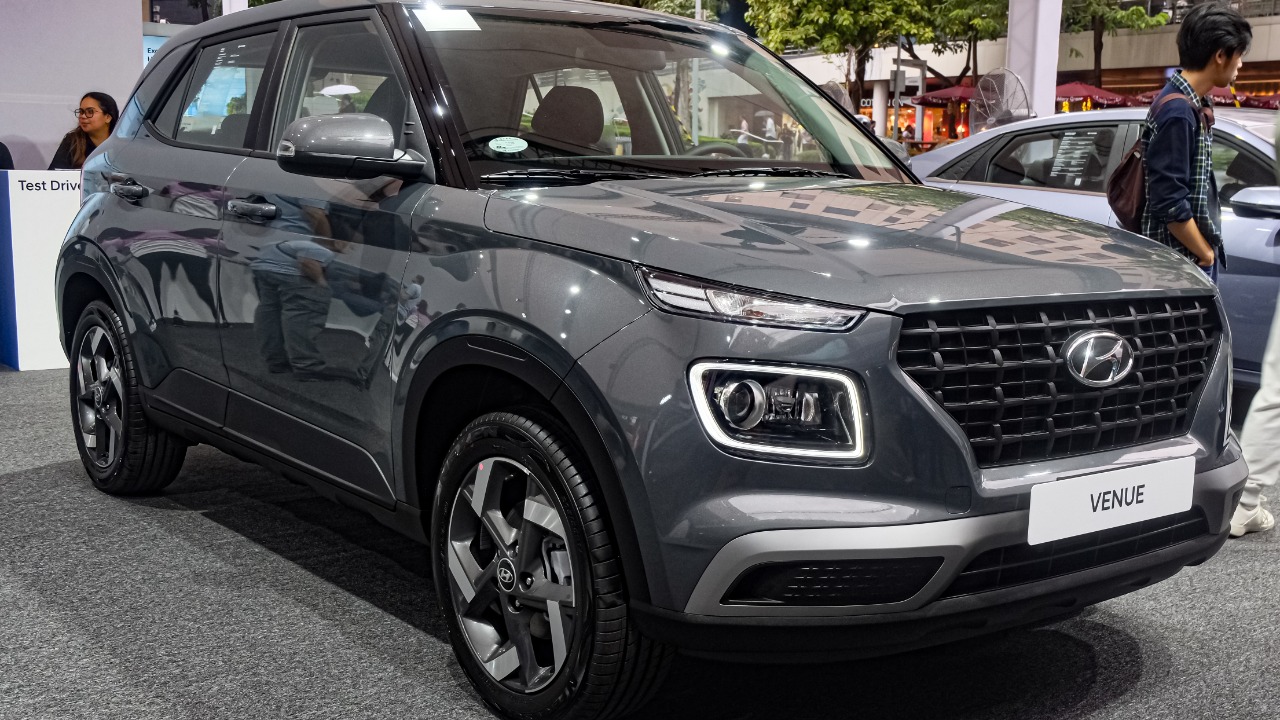
Sitting at the head of the ranking is the Venue, which logged 13.9 fatal accidents per billion miles, or 4.9 times the average for all vehicles. The figure comes from an iSeeCars analysis of NHTSA Fatality Analysis Reporting System data covering 2018 to 2022 model years.
A rate is not a verdict on any single driver or trip. Shoppers weighing a small crossover can treat the number as one signal among several, since the study measures deaths relative to miles driven rather than the odds in any specific crash, and it applies to that model-year window only.
2. Chevrolet Corvette: Supercar Speed Penalty
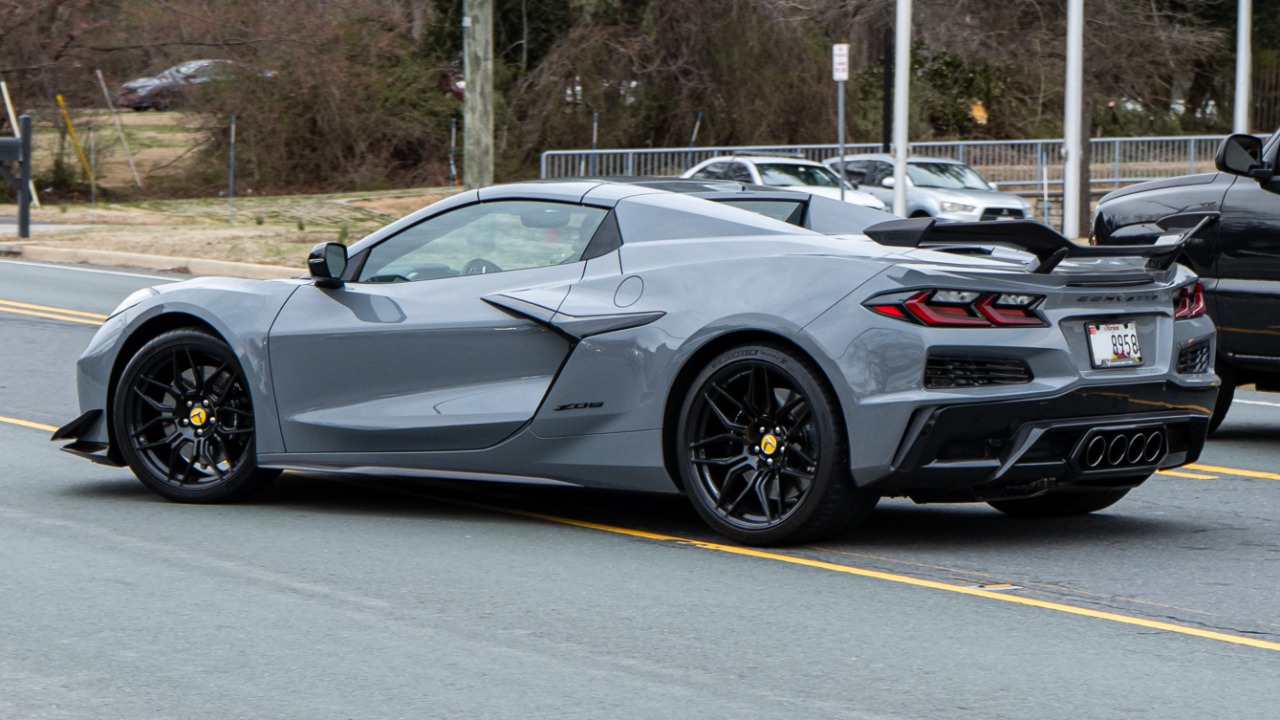
The Corvette posted 13.6 fatal accidents per billion miles, which works out to 4.8 times the average. That puts the sports car just behind the Venue in the same iSeeCars ranking.
Performance cars show up near the top of this kind of list, and the Corvette is no exception. Prospective owners can read the multiple as a reminder that the measure tracks fatal crashes per distance traveled, so a car driven hard or often can climb the table quickly. Both the Corvette and the Mitsubishi Mirage landed on the identical 13.6 figure in separate write-ups of the study.
3. Porsche 911: Sports Car Standard
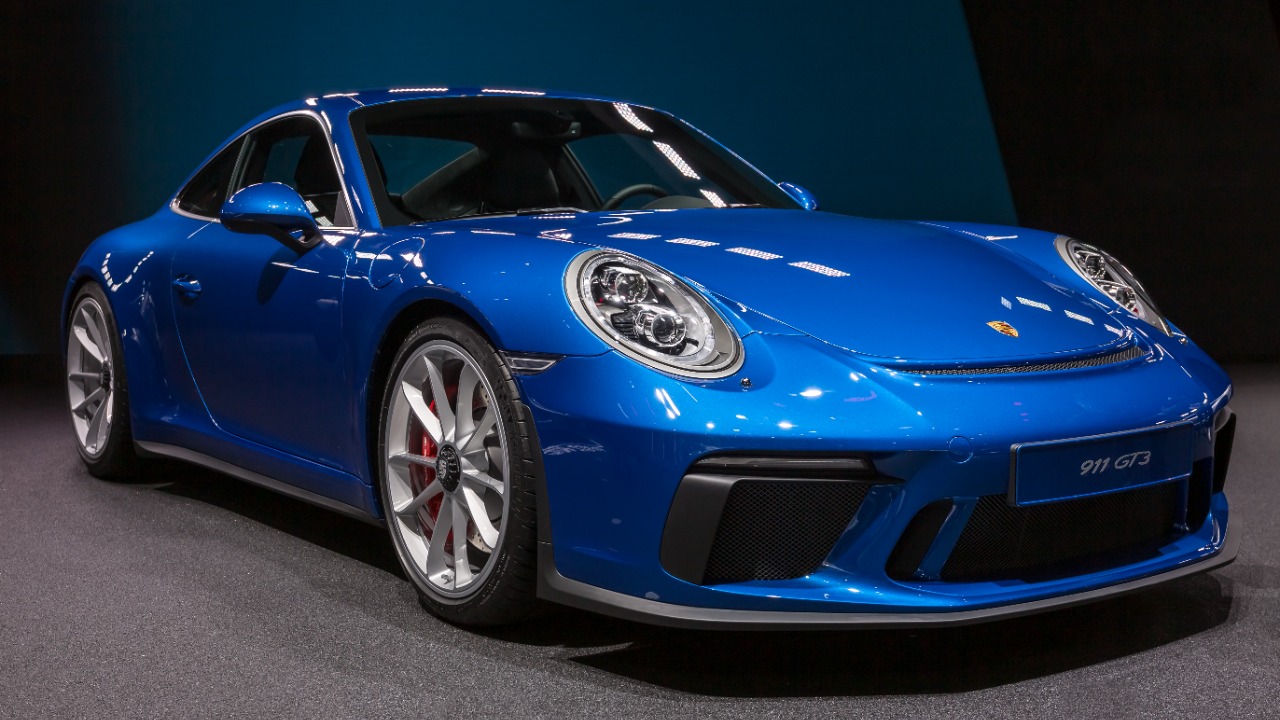
The 911 lands in the top three with 13.2 fatal crashes per billion miles, about 4.6 times the average. The study counts the sports car among the deadliest models by exposure.
The rate describes outcomes across the whole fleet analyzed, not how a well-maintained example behaves in careful hands. Anyone shopping the model should see the 4.6 multiple as context for how the car tends to be driven, set against an overall average of 2.8. The headline number remains the 4.9 multiple held by the Venue at the top.
4. Mitsubishi Mirage: Hatchback, Big Multiple
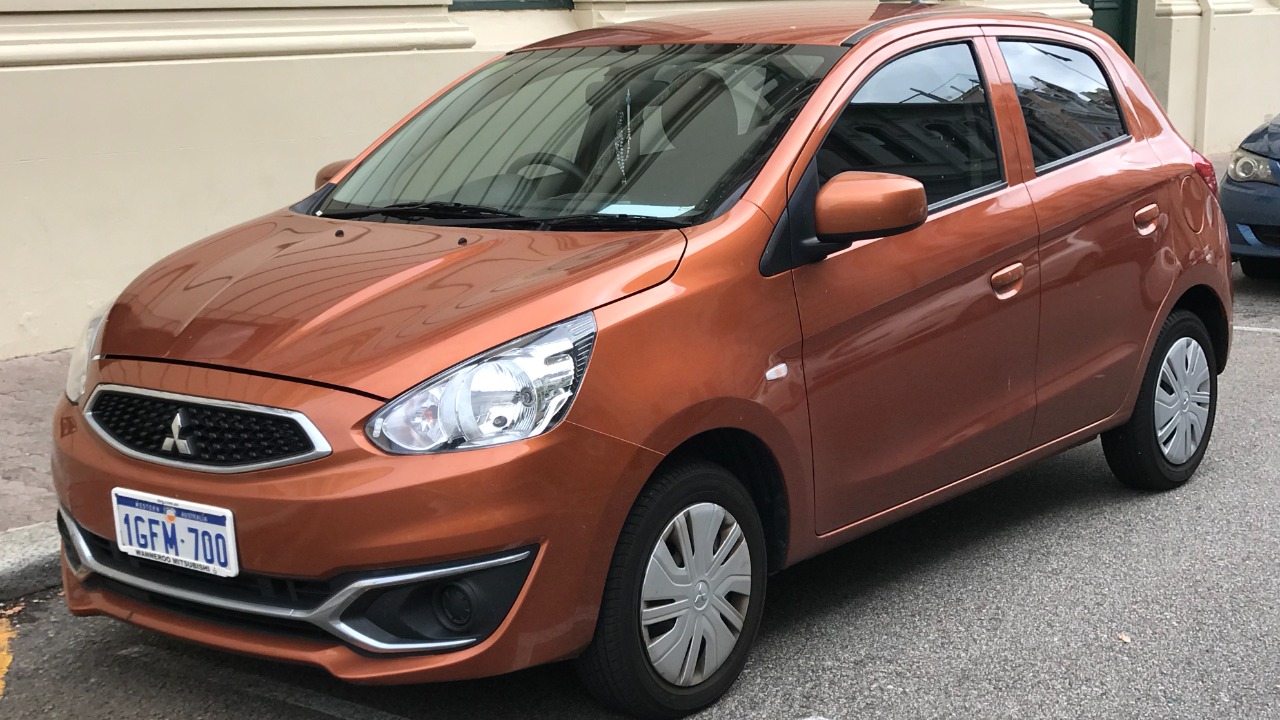
The Mirage recorded 13.6 fatal accidents per billion vehicle miles, matching the Corvette at 4.8 times the average. The hatchback shows that the ranking is not reserved for fast machines.
A tie between an economy hatch and a sports car suggests the metric captures more than horsepower. Buyers comparing entry-level hatchbacks may want to pair this rate with crash-test results, since the figure alone says nothing about why the fatal share runs high. Ranking among the leaders with a hatchback also shows how little the average of 2.8 says about any individual model.
5. Honda CR-V Hybrid: Hybrid Among The Worst
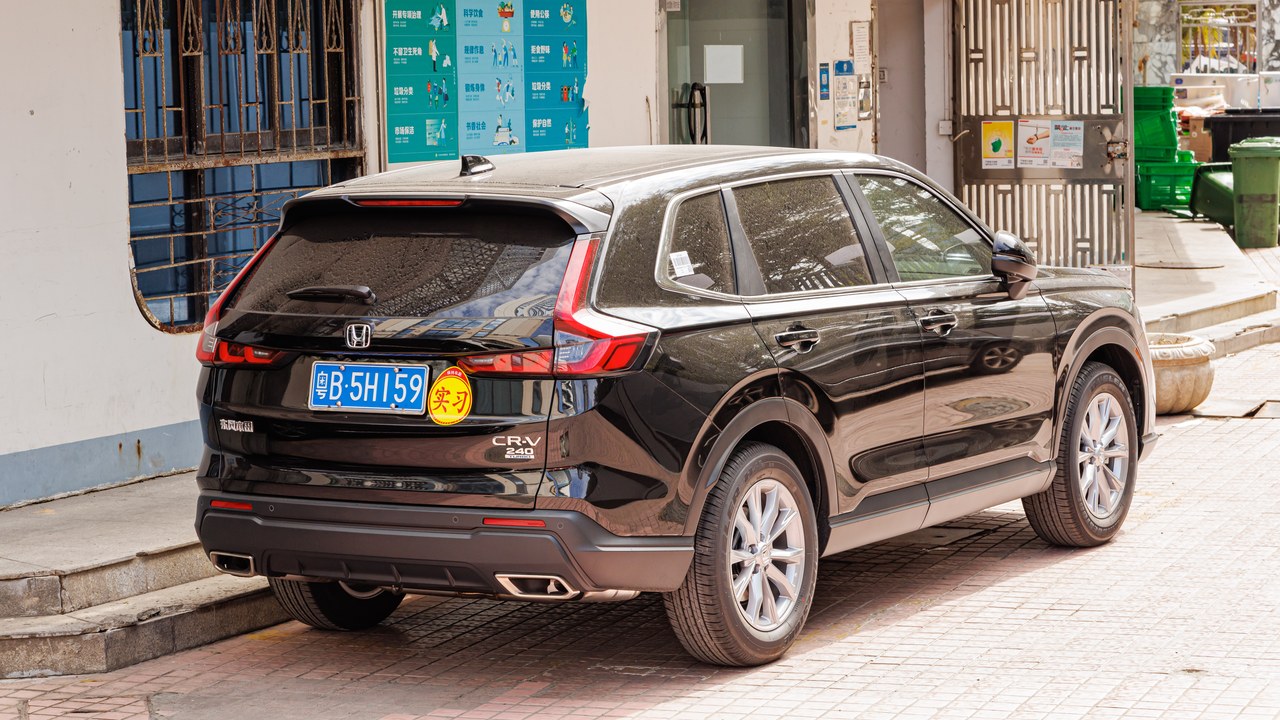
The hybrid version of the Honda SUV scored 13.2 deaths per billion miles, the same 4.6 times average multiple as the 911. It is a surprising entry on a list otherwise filled with sports cars and subcompacts.
Family-oriented crossovers rarely carry this reputation, so the result stands out for shoppers who assumed such models sit near the bottom of the table. The number still reflects aggregate crash data, and the study does not claim to explain it by itself. The Hybrid label in the heading matters, since the figure is reported for that version.
6. Tesla Model Y: Electric Entry
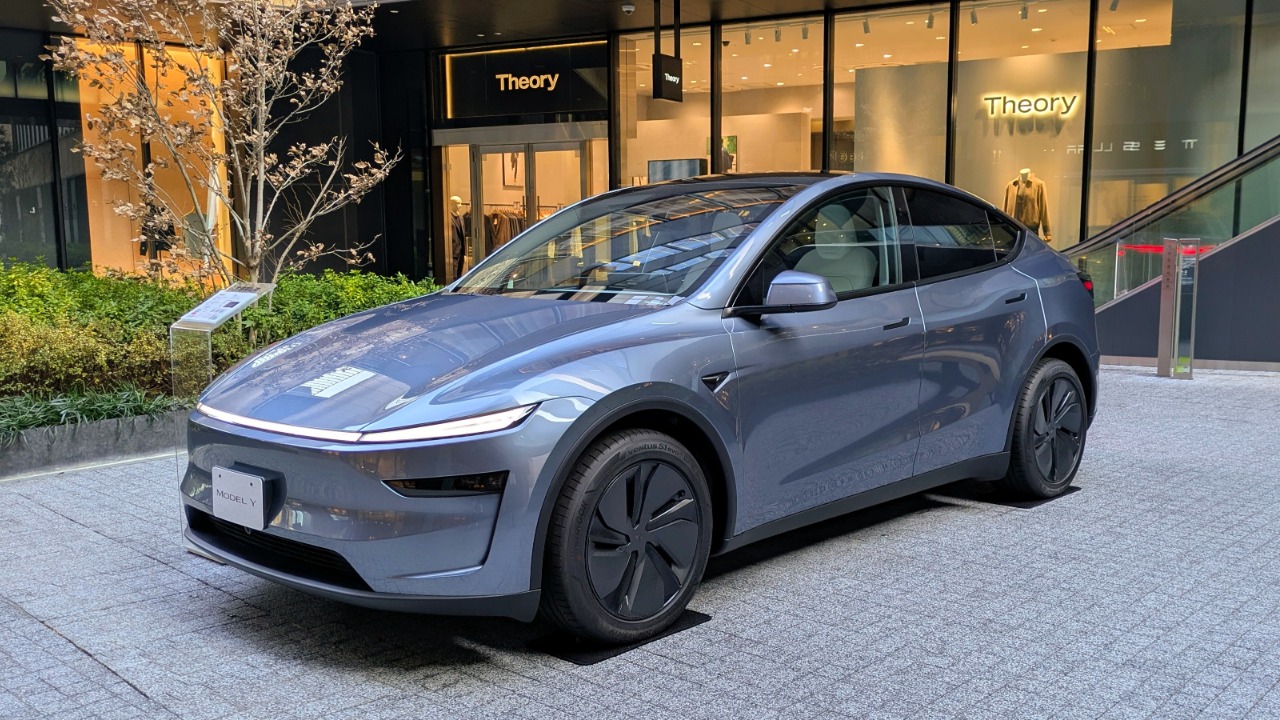
The Model Y appears on the list at 10.6 fatal crashes per billion miles, or 3.7 times the average. That is well below the leaders yet still far above the 2.8 benchmark for all vehicles.
Electric crossovers are often marketed on safety, which makes a multiple above three notable. Drivers and insurers reading the table should keep in mind that the rate blends vehicle design, driver behavior and mileage, so the badge alone does not settle which factor drives the result. Reading the table next to the Venue’s 13.9 puts the Tesla’s number in perspective.
7. Buick Encore GX: Premium Compact Crossover
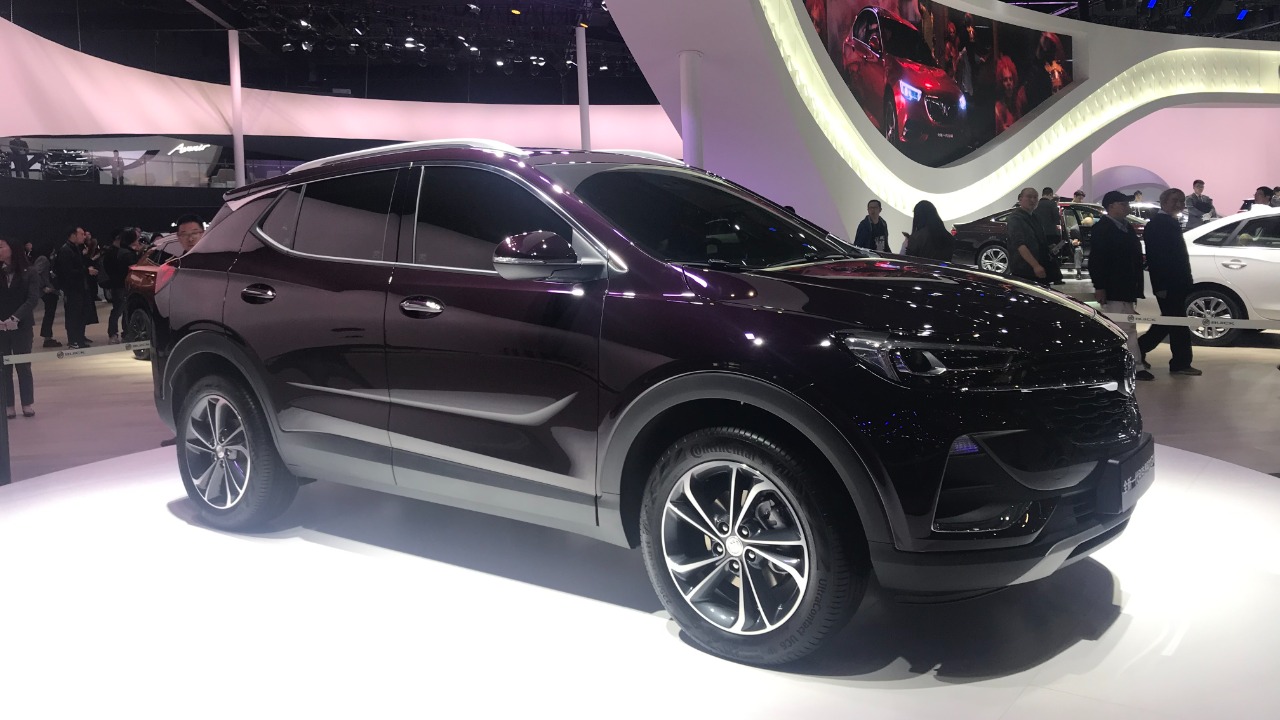
The Encore GX turned up in iSeeCars’ federal crash-data analysis at 9.8 fatal accidents per billion miles. That is roughly three and a half times the 2.8 average for all vehicles, using the figures reported in the study.
The model is a small, relatively affordable crossover, a segment many buyers pick for city and commuter use. The ranking offers one more data point to consider alongside crash-test scores and features, with the caveat that fatal-crash rates summarize past outcomes and not future risk. The Tesla’s 10.6 sits just above this model’s figure, so small gaps between neighbors deserve cautious reading.
8. Kia Forte: Compact Sedan Slot
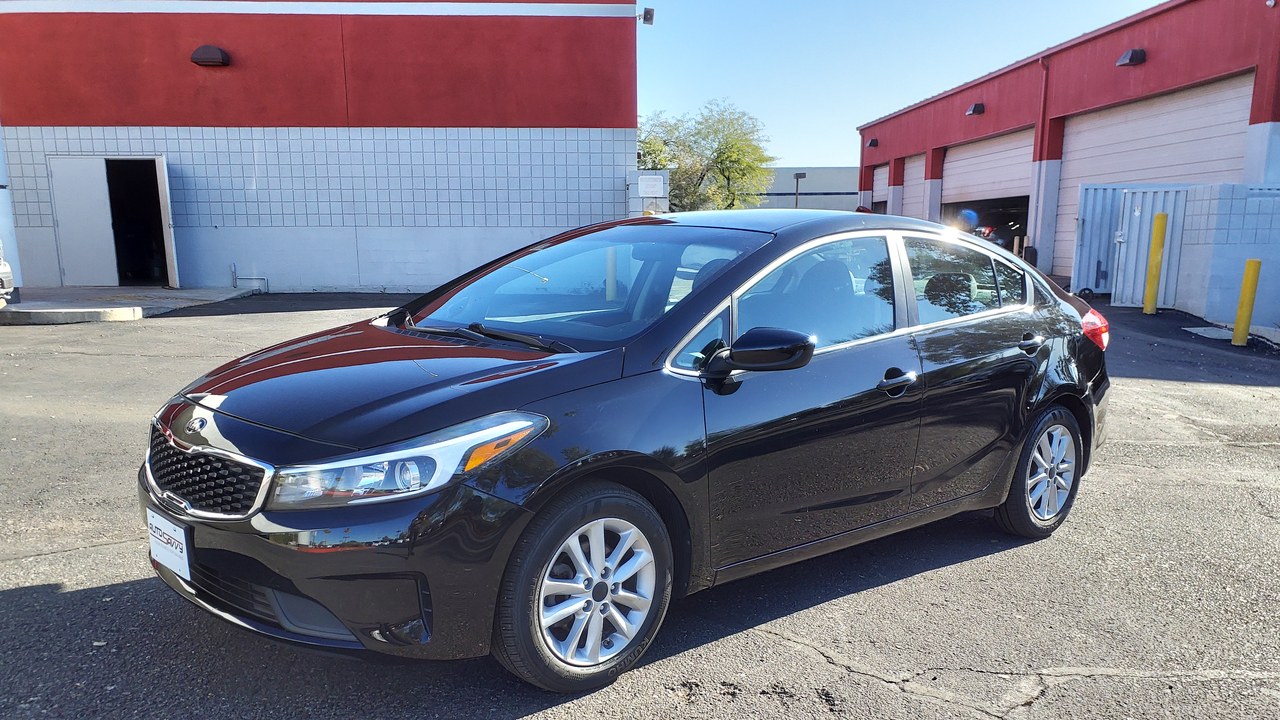
The Forte clocked 8.1 fatal crashes per billion miles in the study. Its maker also ranked second among brands overall at 5.5, which shows the problem is not confined to a single model.
A brand-level figure that high hints at patterns across several vehicles in the lineup. Shoppers considering a compact sedan from that maker can look at both numbers together, remembering that the data reflects how the cars were driven and crashed in practice. Comparing the 8.1 with the Venue’s 13.9 shows the Forte sits well inside the list rather than at the peak.
9. Buick Envision: Last On The List
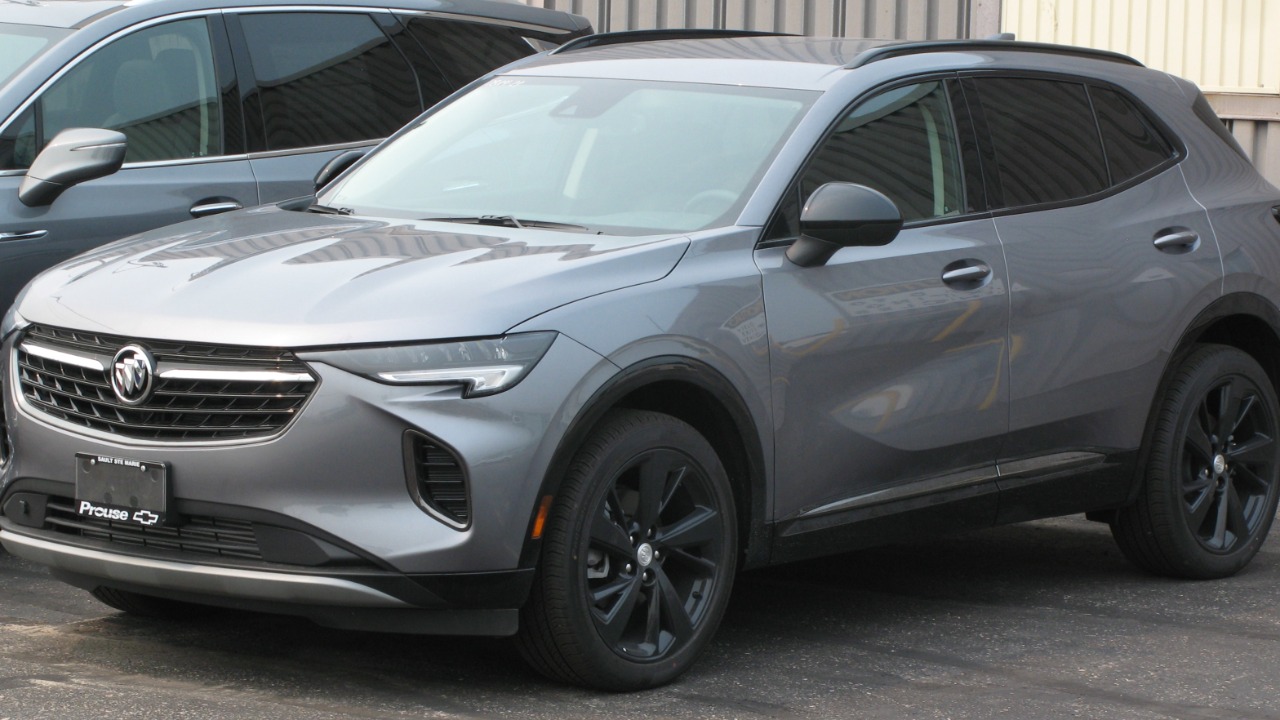
Closing out the list, the Envision recorded 8.0 deaths per billion miles, against a 2.8 average for all vehicles. That is nearly three times the benchmark, enough to make the cut for the study’s deadliest group.
Even the last spot on this list sits well above typical vehicles, so the bottom of the table is hardly a safe zone. Owners and buyers of the crossover should treat the figure as a prompt to review safety ratings, without reading it as a prediction for any one vehicle. That said, 8.0 still ranks among the highest rates reported for any vehicle in the dataset.
